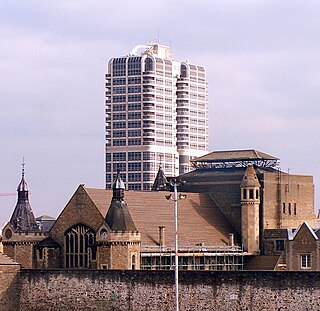
The 2015 Swindon Borough Council election took place on 7 May 2015, to elect members of Swindon Borough Council in England. [1] This was on the same day as other local elections. The Conservative Party increased their majority after gaining two seats. Of the 19 seats up for election, four seats changed hands to leave the Conservatives (32) with a majority of seven seats over Labour (23) and the Lib Dems (2).
Sitting councillors seeking re-election, elected in 2012, are marked with an asterisk (*). The ward results listed below are based on the changes from the 2014 elections, not taking into account any party defections or by-elections.
Party | Candidate | Votes | % | ±% | |
---|---|---|---|---|---|
Conservative | Alan John Bishop * | 3,502 | 55.3 | +7.2 | |
Labour | Pam Adams | 1,523 | 24.1 | +0.4 | |
UKIP | Ross Shugar | 838 | 13.2 | –4.5 | |
Green | Andrew Donald Day | 466 | 7.4 | +0.4 | |
Majority | 1,979 | 31.4 | +7.0 | ||
Turnout | 6,329 | 71.32 | +31.13 | ||
Registered electors | 8,874 | ||||
Conservative hold | Swing |
Party | Candidate | Votes | % | ±% | |
---|---|---|---|---|---|
Labour | Julie Wright * | 2,567 | 45.1 | +7.1 | |
Conservative | Dave Bell | 1,187 | 20.8 | +7.2 | |
Liberal Democrats | Antonio Banjamino Lopes | 1,176 | 20.6 | –12.0 | |
UKIP | Bob Sheppard | 499 | 8.8 | –3.6 | |
Green | Adam Grizzly Wilkinson-Moore | 218 | 3.8 | N/A | |
Independent | Karsten Evans | 48 | 0.8 | N/A | |
Majority | 1,380 | 24.4 | +19.0 | ||
Turnout | 5,695 | 58.87 | +19.15 | ||
Registered electors | 9,674 | ||||
Labour hold | Swing |
Party | Candidate | Votes | % | ±% | |
---|---|---|---|---|---|
Conservative | Fionuala Foley * | 2,056 | 56.4 | +12.1 | |
Labour | Dave Cox | 648 | 17.8 | –0.3 | |
UKIP | Jennifer Mary Jefferies | 445 | 12.2 | –10.0 | |
Green | Paul Sunners | 301 | 8.3 | –1.8 | |
Liberal Democrats | Clive James Hooper | 194 | 5.3 | – | |
Majority | 1,408 | 38.9 | +16.8 | ||
Turnout | 3,644 | 77.09 | +33.01 | ||
Registered electors | 4,727 | ||||
Conservative hold | Swing |
Party | Candidate | Votes | % | ±% | |
---|---|---|---|---|---|
Conservative | Dale James Heenan * | 2,952 | 48.5 | +9.4 | |
Labour | Steve Wakefield | 1,634 | 26.9 | –5.1 | |
UKIP | Brian James Osbourn | 1,082 | 17.8 | –7.2 | |
Green | Lucy Rebecca Wilkinson-Moore | 214 | 3.5 | –0.3 | |
Liberal Democrats | Gerry Taylor | 201 | 3.3 | N/A | |
Majority | 1,318 | 21.7 | +14.6 | ||
Turnout | 6,083 | 68.43 | +26.61 | ||
Registered electors | 8,890 | ||||
Conservative hold | Swing |
Party | Candidate | Votes | % | ±% | |
---|---|---|---|---|---|
Labour | Paul Dixon | 1,692 | 34.8 | +3.5 | |
Liberal Democrats | Toby Robson | 1,247 | 25.9 | –18.9 | |
Conservative | Niki Bartoszewka | 1,072 | 22.3 | +13.5 | |
UKIP | Graham Hyde | 420 | 8.7 | –0.6 | |
Green | Graham Peter Mattingley | 396 | 8.2 | +1.6 | |
Majority | 445 | 9.3 | N/A | ||
Turnout | 4,827 | 61.43 | +22.74 | ||
Registered electors | 7,858 | ||||
Labour gain from Liberal Democrats | Swing |
Party | Candidate | Votes | % | ±% | |
---|---|---|---|---|---|
Labour | John Ballman * | 2,169 | 42.0 | +2.6 | |
Conservative | Clive Duncan Austin | 1,643 | 31.8 | +7.3 | |
UKIP | Ian Robertson | 1,013 | 19.6 | –7.4 | |
Green | Andy Bentley | 335 | 6.5 | –2.6 | |
Majority | 526 | 10.2 | –2.1 | ||
Turnout | 5,160 | 56.39 | +23.90 | ||
Registered electors | 9,151 | ||||
Labour hold | Swing |
Party | Candidate | Votes | % | ±% | |
---|---|---|---|---|---|
Conservative | David Charles Renard * | 3,274 | 53.6 | +15.7 | |
Labour | Manetta Martha Rodrigues | 1,551 | 25.4 | –6.6 | |
UKIP | Ed Gerrard | 975 | 16.0 | –9.6 | |
Green | Simon Johnathan Fairbourn | 308 | 5.0 | N/A | |
Majority | 1,723 | 28.4 | +22.4 | ||
Turnout | 6,108 | 66.60 | +31.86 | ||
Registered electors | 9,171 | ||||
Conservative hold | Swing |
Party | Candidate | Votes | % | ±% | |
---|---|---|---|---|---|
Labour | Chris Watts | 2,007 | 37.8 | +2.9 | |
Conservative | Graham Charles Cherry | 1,968 | 37.1 | +8.3 | |
UKIP | John Short | 962 | 18.1 | –10.3 | |
Green | Rachel Edwards | 199 | 3.8 | –0.8 | |
Liberal Democrats | Raymond Martin James | 157 | 3.1 | –0.2 | |
Majority | 39 | 0.7 | –5.4 | ||
Turnout | 5,303 | 60.65 | +28.11 | ||
Registered electors | 8,743 | ||||
Labour hold | Swing |
Party | Candidate | Votes | % | ±% | |
---|---|---|---|---|---|
Conservative | Caryl Ann Sydney-Smith | 2,439 | 43.7 | +6.8 | |
Labour | Cindy Matthews * | 1,640 | 29.4 | +0.7 | |
UKIP | John Lenton | 940 | 16.9 | –7.6 | |
Liberal Democrats | Christopher Shepherd | 331 | 5.9 | +0.4 | |
Green | Livio Pavone | 225 | 4.0 | –0.3 | |
Majority | 799 | 14.4 | +6.2 | ||
Turnout | 5,575 | 64.52 | +26.91 | ||
Registered electors | 8,760 | ||||
Conservative gain from Labour | Swing |
Party | Candidate | Votes | % | ±% | |
---|---|---|---|---|---|
Labour | Steph Exell | 1,820 | 41.4 | –1.3 | |
Conservative | David Richard Statham Gould | 1,522 | 34.6 | +10.1 | |
UKIP | Lincoln Williams | 691 | 15.7 | –10.4 | |
Green | Tracey Michelle Jeapes | 368 | 8.4 | N/A | |
Majority | 298 | 6.8 | –9.8 | ||
Turnout | 4,401 | 58.05 | +27.12 | ||
Registered electors | 7,581 | ||||
Labour hold | Swing |
Party | Candidate | Votes | % | ±% | |
---|---|---|---|---|---|
Conservative | Claire Ann Ellis | 2,659 | 48.2 | +12.1 | |
Labour | Bob Cretchley | 1,626 | 29.5 | –16.3 | |
UKIP | Terry Richard Davis | 449 | 8.1 | –4.3 | |
Green | Rae McKellar | 439 | 8.0 | N/A | |
Liberal Democrats | Margaret Joan Hooper | 341 | 6.2 | +0.4 | |
Majority | 1,033 | 18.8 | N/A | ||
Turnout | 5,514 | 69.53 | +31.77 | ||
Registered electors | 7,930 | ||||
Conservative hold | Swing |
Party | Candidate | Votes | % | ±% | |
---|---|---|---|---|---|
Labour | Teresa Jessica Page * | 2,154 | 39.5 | –1.3 | |
Conservative | Harriet Katherine Maltby | 1,906 | 34.9 | +10.6 | |
UKIP | David John Rowland | 1,138 | 20.9 | –8.8 | |
Green | Robert Oliver Heritage | 257 | 4.7 | –0.5 | |
Majority | 248 | 4.6 | –6.4 | ||
Turnout | 5,455 | 56.97 | +25.83 | ||
Registered electors | 9,575 | ||||
Labour hold | Swing |
Party | Candidate | Votes | % | ±% | |
---|---|---|---|---|---|
Conservative | Toby Lewis Elliott * | 3,314 | 60.6 | +9.7 | |
Labour | Michelle Agostino | 1,213 | 22.2 | +1.0 | |
UKIP | Terry Reynolds | 658 | 12.0 | –9.4 | |
Green | Simon William Smith | 282 | 5.2 | N/A | |
Majority | 2,101 | 38.5 | +9.1 | ||
Turnout | 5,467 | 62.62 | +34.47 | ||
Registered electors | 8,730 | ||||
Conservative hold | Swing |
Party | Candidate | Votes | % | ±% | |
---|---|---|---|---|---|
Labour | Jim Grant * | 2,394 | 42.7 | –0.6 | |
Conservative | Rahul Tarar | 1,751 | 31.2 | +9.0 | |
UKIP | Peter Thompson-Watt | 1,133 | 20.2 | –8.4 | |
Green | Rod Hebden | 330 | 5.9 | +0.1 | |
Majority | 643 | 11.5 | –3.3 | ||
Turnout | 5,608 | 60.09 | +24.33 | ||
Registered electors | 9,333 | ||||
Labour hold | Swing |
Party | Candidate | Votes | % | ±% | |
---|---|---|---|---|---|
Conservative | Nick Martin * | 2,857 | 50.0 | +13.5 | |
Labour | Mike Heal | 1,430 | 25.0 | –3.0 | |
UKIP | James Coates | 772 | 13.5 | –4.4 | |
Liberal Democrats | James Ellrington Farr | 329 | 5.8 | +2.1 | |
Green | Ken Kimber | 323 | 5.7 | –0.9 | |
Majority | 1,427 | 25.1 | +16.6 | ||
Turnout | 5,711 | 67.75 | +31.31 | ||
Registered electors | 8,429 | ||||
Conservative hold | Swing |
Party | Candidate | Votes | % | ±% | |
---|---|---|---|---|---|
Conservative | Mary Elizabeth Friend * | 2,962 | 58.2 | +6.7 | |
Labour | Jason John Mills | 1,044 | 20.5 | –1.7 | |
UKIP | Brian Stone | 618 | 12.1 | –6.5 | |
Liberal Democrats | Geoff King | 21.5 | 4.2 | –3.4 | |
Majority | 1,918 | 37.8 | N/A | ||
Turnout | 5,091 | 62.38 | +35.02 | ||
Registered electors | 8,161 | ||||
Conservative hold | Swing |
Party | Candidate | Votes | % | ±% | |
---|---|---|---|---|---|
Conservative | John Christopher Haines * | 3,157 | 51.4 | +12.2 | |
Labour | Tim Page | 1,511 | 24.6 | –5.6 | |
UKIP | James Faulkner | 1,175 | 19.1 | –6.8 | |
Green | Howard John March | 304 | 4.9 | N/A | |
Majority | 1,646 | 26.9 | +17.8 | ||
Turnout | 6,147 | 66.15 | +26.17 | ||
Registered electors | 9,292 | ||||
Conservative hold | Swing |
Party | Candidate | Votes | % | ±% | |
---|---|---|---|---|---|
Labour | Emma Bushell | 2,506 | 47.5 | +8.2 | |
Conservative | Ellen Heavens | 1,400 | 26.5 | +7.0 | |
UKIP | Jeff Jefferies | 839 | 15.9 | –12.9 | |
Green | Bill Hughes | 253 | 4.8 | –1.1 | |
Liberal Democrats | Kathleen McCarthy | 226 | 4.3 | –1.8 | |
SDP | Pavlos Chatzinopoulos | 50 | 0.9 | +0.4 | |
Majority | 1,106 | 21.1 | +10.5 | ||
Turnout | 5,274 | 57.27 | +25.27 | ||
Registered electors | 9,209 | ||||
Labour hold | Swing |
Party | Candidate | Votes | % | ±% | |
---|---|---|---|---|---|
Conservative | Cathy Martyn | 1,797 | 39.3 | +6.0 | |
Liberal Democrats | Ann Richards * | 1,184 | 25.9 | +7.1 | |
Labour | Cheryl Lewis | 733 | 16.0 | +2.2 | |
UKIP | Susan Short | 546 | 11.9 | –6.6 | |
Green | Chantelle Amy Smith | 194 | 4.2 | –6.6 | |
Independent | John Francis Newman | 116 | 2.5 | –2.3 | |
Majority | 613 | 13.5 | –1.0 | ||
Turnout | 4,570 | 72.15 | –31.07 | ||
Registered electors | 6,334 | ||||
Conservative gain from Liberal Democrats | Swing |
The Borough of Swindon is a unitary authority area with borough status in Wiltshire, England. Centred on Swindon, it is the most north-easterly district of South West England.
Swindon South is a constituency in the Borough of Swindon, Wiltshire, represented in the House of Commons of the UK Parliament since 2024 by Heidi Alexander of the Labour Party.
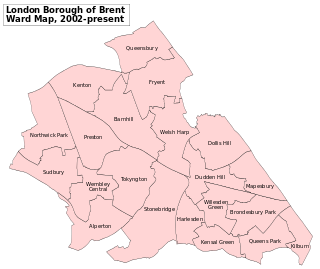
Brent London Borough Council in London, England is elected every four years. Since the last boundary changes in 2022 the council has comprised 57 councillors representing 22 wards, with each ward electing two or three councillors.
Merton London Borough Council in London, England is elected every four years; it has administrative control over the London Borough of Merton.
Justin Paul Tomlinson is a British politician and former marketing executive who served as Minister of State for Energy Security and Net Zero in 2024. A member of the Conservative Party, he was the Member of Parliament (MP) for North Swindon from 2010 to 2024.
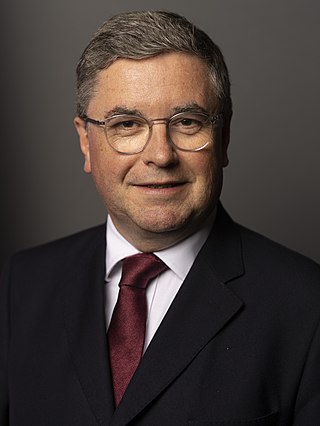
Sir Robert James Buckland is a British politician who served as Lord Chancellor and Secretary of State for Justice from 2019 to 2021, and as Secretary of State for Wales from July to October 2022. A member of the Conservative Party, he was first elected as the member of Parliament (MP) for South Swindon in 2010, holding the seat until the 2024 general election.
The 2007 Swindon Borough Council election took place on 4 May 2007 to elect members of Swindon Unitary Council in Wiltshire, England. One third of the council was up for election and the Conservative Party stayed in overall control of the council.
The 2010 Swindon Borough Council election took place on 6 May 2010 to elect members of Swindon Unitary Council in Wiltshire, England. One third of the council was up for election and the Conservative Party stayed in overall control of the council.
The 2011 Swindon Borough Council election took place on 5 May 2011 to elect members of Swindon Unitary Council in Wiltshire, England. One third of the council was up for election and the Conservative Party stayed in overall control of the council.
Elections to Swindon Borough Council were held on 3 May 2012, with every ward up for election after the implementation of boundary changes. The Conservatives were the largest party on the council going into the elections, and were looking to hold on to power, while Labour were aiming to oust the Conservatives and take control of the council. The election resulted in the Conservatives maintaining control of the council with a majority of one seat, while Labour made gains but not enough to win control.
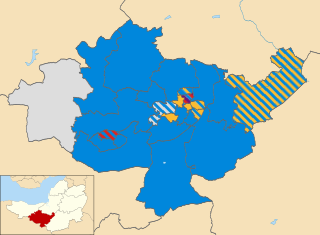
The 2015 Taunton Deane Borough Council election took place on 7 May 2015 to elect all members (councillors) of Taunton Deane Borough Council in Somerset, England. The council changed from being under no overall control to a Conservative majority having won 36 seats, while local Liberal Democrats took by keeping existing seats 14. Labour candidates won two seats, and the UK Independence Party won one, with the three remaining held by Independent candidates.
Elections for the London Borough of Merton were held on 3 May 1990 to elect members of Merton London Borough Council in London, England. This was on the same day as other local elections in England and Scotland.
Elections for the London Borough of Merton were held on 5 May 1994 to elect members of Merton London Borough Council in London, England. This was on the same day as other local elections in England.
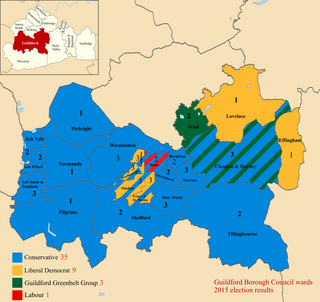
The 2015 Guildford Borough Council election took place on 7 May 2015 to elect members of Guildford Borough Council in England as one of the 2015 local elections, held simultaneously with the General Election.
The 2015 Weymouth and Portland Borough Council election took place on 7 May 2015 to elect 12 members of Weymouth and Portland Borough Council in England. This was on the same day as the 2015 general election.
The 2003 Christchurch Borough Council election took place on 1 May 2003 to elect members of Christchurch Borough Council in Dorset, England. The whole council was up for election after boundary changes reduced the number of seats by one. The Conservative Party stayed in overall control of the council.
The 2016 Woking Borough Council election took place on 5 May 2016 to elect members of Woking Borough Council in England. This was on the same day as other elections across the UK and the Police and Crime Commissioner election for Surrey Police.
The 2018 United Kingdom local elections were held on Thursday 3 May 2018, with local council elections taking place in all 32 London boroughs, 34 metropolitan boroughs, 67 district and borough councils and 17 unitary authorities. There were also direct elections for the mayoralties of Hackney, Lewisham, Newham, Tower Hamlets and Watford.
The 2018 Swindon Borough Council election took place on 3 May 2018, to elect members of Swindon Borough Council in England. This was on the same day as other local elections.
The 2021 Nuneaton and Bedworth Borough Council election was held on 6 May 2021 as part of the 2021 United Kingdom local elections and alongside elections for Warwickshire County Council and Warwickshire Police and Crime Commissioner. Half of the borough council seats were up for election and the results provided the Conservative Party with a majority on the council, with the party winning all but two seats up for election.