This article needs additional citations for verification .(March 2020) |
| |||||||||||||||||||||||||||||||||||||
All 54 council seats 28 seats needed for a majority | |||||||||||||||||||||||||||||||||||||
---|---|---|---|---|---|---|---|---|---|---|---|---|---|---|---|---|---|---|---|---|---|---|---|---|---|---|---|---|---|---|---|---|---|---|---|---|---|
| |||||||||||||||||||||||||||||||||||||
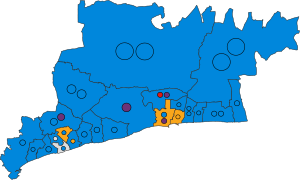
Winner of each seat at the 2015 Arun District Council election | |||||||||||||||||||||||||||||||||||||
|
The Arun District Council elections, 2015 took place on Thursday 7 May 2015, electing all 54 members of the council, and taking place alongside a general election and other local elections in England.
From the previous election, the council had undergone boundary changes which had reduced their number by 2. One councillor in Bersted had defected from the Liberal Democrats to the Green Party, bringing in the first Green councillor on Arun since the authority was formed in 1973.
Following the elections, the Conservatives held control of the council for their 12th term of office, with Cllr Gill Brown continuing as leader.
Party | Seats | Gains | Losses | Net gain/loss | Seats % | Votes % | Votes | +/− | |
---|---|---|---|---|---|---|---|---|---|
Conservative | 42 | 1 | 5 | -4 | 77.8% | 41.6% | 38,322 | -9.3% | |
Liberal Democrats | 5 | 2 | 1 | +1 | 9.3% | 13.7% | 12,627 | -5.0% | |
UKIP | 4 | 4 | 0 | +4 | 7.4% | 22.5% | 20,695 | +14.0% | |
Independent | 2 | 1 | 0 | +1 | 3.7% | 7.7% | 7,081 | +3.4% | |
Labour | 1 | 0 | 2 | -2 | 1.9% | 10.9% | 9,999 | -4.9% | |
Green | 0 | 0 | 0 | 0 | 0% | 3.6% | 3,341 | +3.6% |
Party | Candidate | Votes | % | ±% | |
---|---|---|---|---|---|
Conservative | Trevor Bence* | 1,619 | |||
Conservative | Gillian Brown* | 1,536 | |||
UKIP | Michael Warden | 919 | |||
Independent | Malcolm Daniells | 705 | |||
Liberal Democrats | Peter Wells | 688 | |||
Turnout | 73.57 | ||||
Conservative hold | Swing | ||||
Conservative hold | Swing |
Party | Candidate | Votes | % | ±% | |
---|---|---|---|---|---|
Conservative | Phil Hitchens* | 1,962 | |||
Conservative | Jacqui Maconachie* | 1,397 | |||
UKIP | John Wedderburn | 1122 | |||
Liberal Democrats | Kenton Batley | 698 | |||
Liberal Democrats | Alan Gale | 635 | |||
Turnout | 69.05 | ||||
Conservative hold | Swing | ||||
Conservative hold | Swing |
Party | Candidate | Votes | % | ±% | |
---|---|---|---|---|---|
Conservative | Paul Bicknell* | 2,963 | |||
Conservative | Dudley Wensley* | 2,325 | |||
Conservative | Andrew Cooper* | 2,212 | |||
UKIP | Mark Dyson | 1418 | |||
Liberal Democrats | David Bliss | 998 | |||
Labour | Alison Baker | 887 | |||
Green | Lionel Smith | 796 | |||
Liberal Democrats | Malcolm Taylor | 706 | |||
Turnout | 72.78 | ||||
Conservative hold | Swing | ||||
Conservative hold | Swing |
Party | Candidate | Votes | % | ±% | |
---|---|---|---|---|---|
Conservative | Paul Dendle* | 2,691 | |||
Conservative | Norman Dingemans* | 2,448 | |||
Conservative | Robert Wheal | 1,994 | |||
Independent | Jeremy Johnstone | 1166 | |||
UKIP | Tricia Wales | 1151 | |||
Labour | Christopher Wood | 938 | |||
Turnout | 72.94 | ||||
Conservative hold | Swing | ||||
Conservative hold | Swing |
Party | Candidate | Votes | % | ±% | |
---|---|---|---|---|---|
Conservative | Keith Ballard | 1,994 | |||
Conservative | Christopher Hughes | 1,644 | |||
Conservative | John Charles* | 1,491 | |||
UKIP | Tony Dixon | 1187 | |||
Independent | Ian Truin | 1115 | |||
UKIP | Graham Draper | 1041 | |||
Green | Isabel Thurston | 1033 | |||
Labour | Alwyn Dow | 710 | |||
Turnout | 68.70 | ||||
Conservative hold | Swing | ||||
Conservative hold | Swing |
Party | Candidate | Votes | % | ±% | |
---|---|---|---|---|---|
Liberal Democrats | James Walsh* | 1,671 | |||
Liberal Democrats | Dan Purchese | 1,434 | |||
Conservative | Jill Long | 786 | |||
Labour | Steve McConnell | 260 | |||
Labour | Ron Felpts | 245 | |||
Turnout | 67.73 | ||||
Liberal Democrats hold | Swing | ||||
Liberal Democrats gain from Conservative | Swing |
Party | Candidate | Votes | % | ±% | |
---|---|---|---|---|---|
Conservative | Susan Bence | 1,625 | |||
UKIP | Ann Rapnik | 1,497 | |||
Conservative | Jacqueline Pendleton | 1,156 | |||
Liberal Democrats | Phil Woodall | 798 | |||
Liberal Democrats | Darren Dawes | 795 | |||
Liberal Democrats | James Young | 667 | |||
Green | Simon McDougall* | 647 | |||
Green | Susan Livett | 577 | |||
Green | Martin Lury | 525 | |||
Turnout | 58.36 | ||||
Conservative hold | Swing | ||||
UKIP gain from Conservative | Swing | ||||
Conservative gain from Liberal Democrats | Swing |
Party | Candidate | Votes | % | ±% | |
---|---|---|---|---|---|
Conservative | Alan Gammon* | 1,363 | |||
Conservative | Mick Warren | 1,029 | |||
UKIP | Geoff Holloway | 825 | |||
Labour | Bill Mears | 521 | |||
Liberal Democrats | Anchorette Parvin-Blackstone | 509 | |||
Labour | Mary Mears | 444 | |||
Turnout | 62.69 | ||||
Conservative hold | Swing | ||||
Conservative hold | Swing |
Party | Candidate | Votes | % | ±% | |
---|---|---|---|---|---|
Conservative | Marian Ayers | 1,415 | |||
UKIP | Victoria Rhodes | 991 | |||
Labour | Mike Northeast* | 876 | |||
Labour | Anthony Squires | 866 | |||
Labour | George O'Neill | 709 | |||
Liberal Democrats | Mark Foster | 694 | |||
Liberal Democrats | Paul Graydon | 469 | |||
Liberal Democrats | David Leggatt | 375 | |||
Independent | David Jones | 368 | |||
Turnout | 56.30 | ||||
Conservative hold | Swing | ||||
UKIP gain from Conservative | Swing | ||||
Labour hold | Swing |
Party | Candidate | Votes | % | ±% | |
---|---|---|---|---|---|
Conservative | Richard Bower* | 2,921 | |||
Conservative | Terence Chapman* | 2,909 | |||
Conservative | Mike Clayden | 2,326 | |||
UKIP | Teresa Bullock | 1439 | |||
Labour | Tony Dines | 1081 | |||
Turnout | 72.90 | ||||
Conservative hold | Swing | ||||
Conservative hold | Swing |
Party | Candidate | Votes | % | ±% | |
---|---|---|---|---|---|
Conservative | David Edwards | 1,586 | |||
Conservative | Paul English* | 1,283 | |||
UKIP | Richard Eldred | 961 | |||
Liberal Democrats | Michelle Hibbert | 599 | |||
Liberal Democrats | William Blanchard-Cooper | 457 | |||
Turnout | 69.84 | ||||
Conservative hold | Swing | ||||
Conservative hold | Swing |
Party | Candidate | Votes | % | ±% | |
---|---|---|---|---|---|
Conservative | Gill Madeley* | 1,505 | |||
Conservative | Elaine Stainton* | 1,186 | |||
UKIP | Graham Jones | 960 | |||
Liberal Democrats | Michael Chapman | 498 | |||
Liberal Democrats | Adrian Thorpe | 429 | |||
Turnout | 69.67 | ||||
Conservative hold | Swing | ||||
Conservative hold | Swing |
Party | Candidate | Votes | % | ±% | |
---|---|---|---|---|---|
Conservative | Roger Elkins* | 1,950 | |||
Conservative | Colin Oliver-Redgate* | 1,699 | |||
UKIP | Helen O'Connor-Dixon | 762 | |||
Labour | Steve O'Donnell | 523 | |||
Labour | Michael Brown | 476 | |||
Turnout | 76.67 | ||||
Conservative hold | Swing | ||||
Conservative hold | Swing |
Party | Candidate | Votes | % | ±% | |
---|---|---|---|---|---|
Conservative | Steve Reynolds | 849 | |||
Liberal Democrats | Paul Wells | 770 | |||
Liberal Democrats | Janina Cooper | 593 | |||
Labour | Pauline Nash | 340 | |||
Labour | Simon Mouatt | 326 | |||
Green | David Meagher | 289 | |||
Green | Conrad Meagher | 262 | |||
Turnout | 51.79 | ||||
Conservative hold | Swing | ||||
Liberal Democrats hold | Swing |
Party | Candidate | Votes | % | ±% | |
---|---|---|---|---|---|
Independent | Jim Brooks* | 994 | |||
Conservative | Dougal Maconachie | 857 | |||
UKIP | Martin Lineham | 774 | |||
Labour | Richard Dawson | 631 | |||
Turnout | 50.80 | ||||
Independent hold | Swing | ||||
Conservative hold | Swing |
Party | Candidate | Votes | % | ±% | |
---|---|---|---|---|---|
Conservative | Barbara Oakley | 1,651 | |||
Conservative | Paul Wotherspoon | 1,354 | |||
UKIP | Joan Phillips | 1063 | |||
Liberal Democrats | Stephen Hearn | 524 | |||
Liberal Democrats | Sandra Toovey | 498 | |||
Turnout | 72.80 | ||||
Conservative hold | Swing | ||||
Conservative hold | Swing |
Party | Candidate | Votes | % | ±% | |
---|---|---|---|---|---|
Liberal Democrats | Francis Oppler* | 963 | |||
Conservative | Leonard Brown* | 884 | |||
Liberal Democrats | Bill Toovey | 693 | |||
Labour | Jan Cosgrove | 596 | |||
Labour | Michelle White | 430 | |||
Pawel Kozuchowski | 93 | ||||
Turnout | 54.56 | ||||
Liberal Democrats hold | Swing | ||||
Conservative hold | Swing |
Party | Candidate | Votes | % | ±% | |
---|---|---|---|---|---|
Conservative | Anita Dawn Hall* | 1,894 | |||
Conservative | Ashvinkumar Patel* | 1,374 | |||
UKIP | Tony Sutcliffe | 1365 | |||
Liberal Democrats | Catherine Morrish | 749 | |||
Liberal Democrats | Jeanette Warr | 505 | |||
Turnout | 70.70 | ||||
Conservative hold | Swing | ||||
Conservative hold | Swing |
Party | Candidate | Votes | % | ±% | |
---|---|---|---|---|---|
Conservative | Pat Dillon | 802 | |||
Independent | Sandra Daniells | 778 | |||
Independent | Adam Cunard | 691 | |||
Labour | Roger Nash* | 578 | |||
Labour | Gilbert Cockburn | 464 | |||
Turnout | 54.60 | ||||
Conservative hold | Swing | ||||
Independent gain from Labour | Swing |
Party | Candidate | Votes | % | ±% | |
---|---|---|---|---|---|
Liberal Democrats | Ian Buckland | 1,239 | |||
Conservative | George Blampied | 1,172 | |||
UKIP | Colin Cates | 1,009 | |||
Independent | Malcolm Belchamber | 1002 | |||
Labour | Alan Butcher | 844 | |||
Liberal Democrats | Joan Rickeard | 751 | |||
Liberal Democrats | Emily Tester | 608 | |||
Labour | Bernie May | 600 | |||
Green | David Austin | 576 | |||
Labour | Maralyn May | 570 | |||
Turnout | 57.03 | ||||
Liberal Democrats gain from Conservative | Swing | ||||
Conservative hold | Swing | ||||
UKIP gain from Labour | Swing |
Party | Candidate | Votes | % | ±% | |
---|---|---|---|---|---|
Conservative | Emma Neno | 1,509 | 30.7% | ||
Conservative | Graham Tyler* | 1,394 | 28.4% | ||
UKIP | Stewart England | 802 | 16.3% | ||
Liberal Democrats | Jamie Bennett | 421 | 8.6% | ||
Labour | Adrian Midgley | 413 | 8.4% | ||
Liberal Democrats | Trevor Richards | 378 | 7.7% | ||
Turnout | 4,917 | 68.13 | |||
Conservative hold | Swing | ||||
Conservative hold | Swing |
Party | Candidate | Votes | % | ±% | |
---|---|---|---|---|---|
Conservative | Phillipa Bower | 2,362 | |||
Conservative | Pauline Harrison-Horn | 2,284 | |||
Conservative | Stella Porter | 1,847 | |||
UKIP | Paul Davis | 1267 | |||
Independent | Alison Cooper | 860 | |||
Liberal Democrats | Anne Purchese | 808 | |||
Labour | Nigel Stapley | 801 | |||
Liberal Democrats | Joanne Calvert | 675 | |||
Joby Akira | 203 | ||||
Turnout | 70.29 | ||||
Conservative hold | Swing | ||||
Conservative hold | Swing |
Party | Candidate | Votes | % | ±% | |
---|---|---|---|---|---|
Conservative | Stephen Haymes* | 1,962 | |||
UKIP | Derek Ambler | 1,183 | |||
Conservative | Gary Markwell | 1125 | |||
Turnout | 65.50 | ||||
Conservative hold | Swing | ||||
UKIP gain from Conservative | Swing |
Arun is a local government district in West Sussex, England. Its council is based in Littlehampton. The district's other towns are Arundel and Bognor Regis. The district is named after the River Arun, which runs through the centre of the district. Parts of the district fall within the South Downs National Park.
Chichester is a local government district in West Sussex, England. It is named after the city of Chichester, which is its largest settlement and where the council is based. The district includes the towns of Midhurst, Petworth and Selsey and surrounding rural areas, including many villages. The district includes part of the South Downs National Park, and Chichester Harbour is a designated Area of Outstanding Natural Beauty. At the 2021 census the district had a population of 124,531.
Arun District Council in West Sussex, England is elected every four years. Since the last boundary changes in 2015, 54 councillors have been elected from 23 wards.
The 2003 Arun District Council election took place on 1 May 2003 to elect members of Arun District Council in West Sussex, England. The whole council was up for election with boundary changes since the last election in 1999. The Conservative Party stayed in overall control of the council.
The 2012 St Albans City and District Council election took place on 3 May 2012 to elect members of St Albans District Council in Hertfordshire, England. One third of the council was up for election and the council stayed under no overall control.
The West Sussex County Council election, 2013 took place on 2 May 2013, as part of the 2013 United Kingdom local elections. All 71 electoral divisions were up for election, which returned one county councillor each by first-past-the-post voting for a four-year term of office. At this election, the Conservative Party was seeking to retain overall control of the council, and the Liberal Democrats to maintain their position as the main opposition party.
The 2014 St Albans City and District Council election took place on 22 May 2014 to elect members of St Albans District Council in Hertfordshire, England. One third of the council was up for election and the council stayed under no overall control.
The 1856 New South Wales colonial election was to return 54 members of Legislative Assembly composed of 34 electoral districts with 18 returning 1 member, 13 returning 2 members, two returning 3 members and one returning 4 members, all with a first past the post system. In multi-member districts, because each voter could cast more than one vote, it is not possible to total the votes to show the number of voters and voter turnout in these districts is estimated. 8 members from 6 districts were returned unopposed.
The 2015 Breckland District Council election took place on 7 May 2015 to elect members of Breckland District Council in England. This was on the same day as other local elections.
Elections to Cannock Chase District Council took place on 7 May 2015 on the same day as other local elections in England as well as a general election. A third of the council was up for election, meaning a total of 15 councillors were elected from all of the council's wards.
The 2002 West Oxfordshire District Council election took place on 2 May 2002 to elect members of West Oxfordshire District Council in Oxfordshire, England. The whole council was up for election with boundary changes since the last election in 2000. The Conservative Party stayed in overall control of the council.
The 2003 West Oxfordshire District Council election took place on 1 May 2003 to elect members of West Oxfordshire District Council in Oxfordshire, England. One third of the council was up for election and the Conservative Party stayed in overall control of the council.
The 2006 West Oxfordshire District Council election took place on 4 May 2006 to elect members of West Oxfordshire District Council in Oxfordshire, England. One third of the council was up for election and the Conservative Party stayed in overall control of the council.
The 2008 West Oxfordshire District Council election took place on 1 May 2008 to elect members of West Oxfordshire District Council in Oxfordshire, England. One third of the council was up for election and the Conservative Party stayed in overall control of the council.
The 2012 West Oxfordshire District Council election took place on 3 May 2012 to elect members of West Oxfordshire District Council in Oxfordshire, England. One third of the council was up for election and the Conservative Party stayed in overall control of the council.
The 2019 Breckland District Council election took place on 2 May 2019 to elect members of Breckland District Council in England. This was on the same day as other local elections. The boundaries for this election were the same as those used in 2015.
Elections to Cannock Chase District Council took place on 2 May 2019 on the same day as other local elections in England, including to several parish councils in the district. All of the council's wards were up for election, meaning a total of 15 councillors were elected.
The 2019 St Albans City and District Council election took place on 2 May 2019 to elect members of St Albans City and District Council in England. This was on the same day as other local elections. At the elections, the Conservatives lost control of the council
The Arun District Council elections, 2019 took place on Thursday 2 May 2019, electing all 54 members of the council, and taking place alongside the other local elections in England and Northern Ireland.
The 2023 Horsham District Council election took place on 4 May 2023 to elect members of Horsham District Council in West Sussex, England. It was held on the same day as other local elections in England.