| |||||||||||||||||||||||||||||||||||||||||||||
| |||||||||||||||||||||||||||||||||||||||||||||
All 55 seats to Medway Council 28 seats needed for a majority | |||||||||||||||||||||||||||||||||||||||||||||
---|---|---|---|---|---|---|---|---|---|---|---|---|---|---|---|---|---|---|---|---|---|---|---|---|---|---|---|---|---|---|---|---|---|---|---|---|---|---|---|---|---|---|---|---|---|
| |||||||||||||||||||||||||||||||||||||||||||||
Map of results of 2015 election | |||||||||||||||||||||||||||||||||||||||||||||
|
The 2015 Medway Council election took place on 7 May 2015, alongside the 2015 UK General Election. The elections were to elect all 55 seats across 22 wards. The Conservatives held the council, with 36 seats (a majority of 16). The Labour Party won 15 seats, and UKIP took 4.
Following the announcement of the results, the Trade Unionist and Socialist Coalition called for a re-count in Rainham North ward after their candidate received no votes, despite claiming that he had voted for himself; however, the council's returning officer confirmed that the result was correct and no further action could be taken. [1]
Party | Seats | Gains | Losses | Net gain/loss | Seats % | Votes % | Votes | +/− | |
---|---|---|---|---|---|---|---|---|---|
Conservative | 36 | +1 | 65.5 | 42.9 | 120,319 | +3.2 | |||
Labour | 15 | 0 | 27.3 | 27.9 | 78,195 | -6.6 | |||
UKIP | 4 | +4 | 7.2 | 21.8 | 61,272 | +20.0 | |||
Liberal Democrats | 0 | 0 | 0 | -3 | 0 | 3.2 | 8,998 | -5.6 | |
Green | 0 | 0 | 0 | 0 | 0 | 2.3 | 6,551 | 0.3 | |
TUSC | 0 | 0 | 0 | 0 | 0 | 1.2 | 3,402 | +0.7 | |
Independent | 0 | 0 | 0 | -2 | 0 | 0.6 | 1,759 | -3.8 | |
English Democrat | 0 | 0 | 0 | 0 | 0 | 0.1 | 120 | -1.5 |
A total of 1,735 ballot papers were rejected.
Prior to the election, the composition of the council was:
35 | 15 | 3 | 2 |
Conservative | Labour | LD | I |
After the election, to composition of the council was:
36 | 15 | 4 |
Conservative | Labour | UKIP |
I - Independent
An asterisk denotes an incumbent councillor seeking re-election.
Party | Candidate | Votes | % | ±% | |
---|---|---|---|---|---|
Labour | Paul Goodwin* | 2,258 | 17.3 | −3.7 | |
Labour | Vince Maple* | 2,238 | 17.1 | −3.5 | |
Labour | Julie Nora Shaw* | 1,987 | 15.2 | −6.4 | |
UKIP | Robin Charles Johnson | 1,535 | 11.7 | +8.2 | |
Conservative | Patricia Anne Gulvin | 1,394 | 10.6 | +1.7 | |
Conservative | David Peter Jarrett | 1,258 | 9.6 | +1.0 | |
Conservative | Andrew Kennedy | 1,208 | 9.2 | +1.0 | |
Green | Luke Ashley Balnave | 727 | 5.6 | N/A | |
Green | John Lesley Gibson | 263 | 2.0 | N/A | |
TUSC | Steven Hancock | 219 | 1.7 | N/A | |
Majority | 452 | 3.5 | |||
Turnout | 13,087 | ||||
Labour hold | Swing | ||||
Labour hold | Swing |
Party | Candidate | Votes | % | ±% | |
---|---|---|---|---|---|
Conservative | Matt Fearn | 1,761 | 53.8 | −9.6 | |
UKIP | Paul Monck | 958 | 29.3 | N/A | |
Labour | Michael Gerald Evans | 518 | 15.8 | −20.8 | |
TUSC | Allan Yates | 37 | 1.1 | N/A | |
Majority | 803 | 24.5 | |||
Turnout | 3,274 | ||||
Conservative hold | Swing |
Party | Candidate | Votes | % | ±% | |
---|---|---|---|---|---|
Labour | Pat Cooper* | 2,449 | 16.5 | +5.8 | |
Labour | Andy Stamp* | 2,258 | 15.2 | +4.5 | |
Labour | Adam Robert William Price* | 2,026 | 13.7 | +2.5 | |
UKIP | Mark Mencattelli | 1,846 | 12.4 | N/A | |
Conservative | Nusrat Bibi Ahmed | 1,475 | 9.9 | +2.7 | |
Conservative | Bob Russell | 1,396 | 9.4 | +3.3 | |
Conservative | Kwashie Amartei Anang | 1,368 | 9.2 | +4.2 | |
Green | Trich Marchant | 646 | 4.4 | +2.1 | |
Liberal Democrats | Steve Kearney | 436 | 2.9 | −0.2 | |
Liberal Democrats | Sid Kingman | 334 | 2.3 | −0.7 | |
Liberal Democrats | Anita Sheila Webber | 327 | 2.2 | −0.4 | |
TUSC | Andrew Paul Travers | 278 | 1.9 | +0.9 | |
Majority | 180 | 1.3 | |||
Turnout | 14,839 | ||||
Labour gain from Independent | Swing | ||||
Labour hold | Swing |
Cllrs Cooper and Stamp both were previously elected as Independent councillors in 2011.
Party | Candidate | Votes | % | ±% | |
---|---|---|---|---|---|
Labour | Clive Stanley William Johnson | 1,995 | 11.2 | 0 | |
Labour | Naushabah Parveen Khan | 1,909 | 10.7 | +0.3 | |
Labour | Dan McDonald | 1,877 | 10.6 | +1.0 | |
UKIP | Terry Allen | 1,777 | 10.0 | +7.2 | |
Conservative | Saboor Ahmed | 1,537 | 8.6 | +1.7 | |
UKIP | John Farrell | 1,469 | 8.3 | +6.0 | |
UKIP | Rob McCulloch Martin | 1,413 | 8.0 | N/A | |
Conservative | Shirley Margaret Pamela Griffiths | 1,405 | 7.9 | −0.1 | |
Conservative | John Richard Amey | 1,343 | 7.5 | +2.2 | |
Liberal Democrats | Geoff Juby* | 871 | 4.9 | −6.5 | |
Liberal Democrats | Tony Jeacock | 697 | 3.9 | −6.7 | |
Liberal Democrats | Chris Sams | 629 | 3.5 | −6.9 | |
Green | Simon Philip Marchant | 552 | 3.1 | +0.2 | |
TUSC | Jacqui Berry | 316 | 1.8 | −0.3 | |
Majority | 100 | 0.6 | |||
Turnout | 17,790 | ||||
Labour gain from Liberal Democrats | Swing | ||||
Labour hold | Swing |
Party | Candidate | Votes | % | ±% | |
---|---|---|---|---|---|
Conservative | Diane Margaret Chambers* | 3,666 | 40.5 | +11.9 | |
Conservative | Rodney Brian Chambers* | 3,555 | 39.3 | +11.2 | |
Labour | Ahmed Mutahir Khan | 828 | 9.2 | +1.5 | |
Labour | Nabilah Khan | 749 | 8.3 | +1.8 | |
TUSC | Stephen John Wilkins | 245 | 2.7 | N/A | |
Majority | 2,727 | 30.1 | |||
Turnout | 9,043 | ||||
Conservative hold | Swing | ||||
Conservative hold | Swing |
Party | Candidate | Votes | % | ±% | |
---|---|---|---|---|---|
Conservative | Alan Leslie Jarrett* | 2,711 | 36.1 | +4.3 | |
Conservative | David Robert Wildey* | 2,341 | 31.7 | +2.8 | |
Labour | Nick Alderson-Rice | 1,110 | 15.0 | −0.8 | |
Labour | Ambrose Nwodoh | 987 | 13.4 | −0.8 | |
TUSC | Tony Baker | 233 | 3.2 | N/A | |
Majority | 1,231 | 16.7 | |||
Turnout | 7,382 | ||||
Conservative hold | Swing | ||||
Conservative hold | Swing |
Party | Candidate | Votes | % | ±% | |
---|---|---|---|---|---|
Labour | Tris Osborne* | 1,774 | 12.5 | −3.0 | |
Labour | Sam Craven* | 1,748 | 12.3 | −5.1 | |
Conservative | Michael Franklin | 1,745 | 12.3 | −0.7 | |
Labour | Christine Janice Godwin* | 1,685 | 11.9 | −5.2 | |
UKIP | Stephen Harper | 1,508 | 10.6 | N/A | |
Conservative | Stephen John Peachell | 1,496 | 10.6 | −4.2 | |
Conservative | Simon John Wray | 1,411 | 10.0 | −1.6 | |
UKIP | Claire Rachel Sparham | 1,353 | 9.6 | N/A | |
UKIP | Maurice Granville Sparham | 1,171 | 8.3 | N/A | |
TUSC | Alison Burns | 154 | 1.1 | −0.8 | |
English Democrat | Mike Russell | 120 | 0.8 | N/A | |
Majority | 60 | 0.4 | |||
Turnout | 14,165 | ||||
Conservative gain from Labour | Swing | ||||
Labour hold | Swing | ||||
Labour hold | Swing |
Party | Candidate | Votes | % | ±% | |
---|---|---|---|---|---|
UKIP | Roy Freshwater | 2,866 | 14.7 | N/A | |
Conservative | Phil Filmer* | 2,722 | 14.0 | −7.9 | |
UKIP | Mick Pendergast | 2,610 | 13.4 | N/A | |
Conservative | Michael Dale | 2,461 | 12.6 | −7.2 | |
Conservative | Jim Nugent | 2,440 | 12.5 | −5.7 | |
UKIP | Mike Yates | 2,310 | 11.9 | N/A | |
Labour | Julia Cherry | 1,200 | 6.2 | −2.1 | |
Labour | Peter John Tungate | 1,091 | 5.6 | −2.1 | |
Labour | Patrick Minhard | 931 | 4.8 | −2.7 | |
Independent | Ron Sands | 691 | 3.5 | N/A | |
TUSC | Chas Berry | 147 | 0.8 | N/A | |
Majority | 149 | 0.8 | |||
Turnout | 19,469 | ||||
UKIP gain from Conservative | Swing | ||||
Conservative hold | Swing |
Sands previously stood as a candidate for the English Democrats in 2011.
Party | Candidate | Votes | % | ±% | |
---|---|---|---|---|---|
Conservative | Tashi Bhutia | 1,811 | 24.5 | −4.6 | |
Conservative | Gloria Blessing Chukwuka Opara | 1,633 | 22.1 | −3.7 | |
UKIP | Adam Crombie | 1,144 | 15.4 | N/A | |
Labour | Alan Higgins | 1,029 | 13.9 | −4.5 | |
UKIP | Richard John Wozencroft | 907 | 12.2 | N/A | |
Labour | Simon Wady | 821 | 11.1 | −7.9 | |
TUSC | Janet Sylvia Baker | 60 | 0.8 | N/A | |
Majority | 489 | 6.7 | |||
Turnout | 7,405 | ||||
Conservative hold | Swing | ||||
Conservative hold | Swing |
Party | Candidate | Votes | % | ±% | |
---|---|---|---|---|---|
Conservative | Rehman Chishti | 4,386 | 25.6 | +1.8 | |
Conservative | Barry Joseph Kemp | 3,473 | 20.3 | −0.1 | |
Conservative | Mike O'Brien | 3,115 | 18.2 | +2.4 | |
UKIP | Rebecca Mencattelli | 1,854 | 10.8 | +7.4 | |
Labour | Mark Anthony Last | 1,405 | 8.2 | +0.6 | |
Labour | Tarek James Maddison | 1,018 | 6.0 | +1.5 | |
Labour | James Richard Smith | 946 | 5.5 | +1.9 | |
Green | Mary Winifred Smtih | 665 | 3.9 | +1.6 | |
TUSC | Carole Diane Sammon | 165 | 1.0 | N/A | |
Independent | Karen Dawn Streatfield | 92 | 0.5 | N/A | |
Majority | 1,261 | 7.4 | |||
Turnout | 17,119 | ||||
Conservative hold | Swing | ||||
Conservative hold | Swing |
Party | Candidate | Votes | % | ±% | |
---|---|---|---|---|---|
Conservative | David John Carr* | 2,247 | 26.5 | −1.2 | |
Conservative | Martin Potter | 1,910 | 22.6 | −3.7 | |
UKIP | Vaughan Baden Hewett* | 1,245 | 14.7 | +10.8 | |
UKIP | Emily Catherine Knowles | 850 | 10.0 | +6.8 | |
Labour | John William Lloyd | 837 | 9.9 | −1.1 | |
Labour | Chiron Peter Mottram | 598 | 7.1 | −3.5 | |
Liberal Democrats | John Edward Castle | 272 | 3.2 | −6.3 | |
Green | Neil Peter Williams | 254 | 3.0 | N/A | |
Liberal Democrats | Terry Lucy | 251 | 3.0 | −4.8 | |
TUSC | Paul Andrew Dennis | 0 | 0.0 | N/A | |
Majority | 665 | 7.9 | |||
Turnout | 8,464 | ||||
Conservative hold | Swing | ||||
Conservative hold | Swing |
Hewett was previously elected in 2011 as a Conservative councillor.
Party | Candidate | Votes | % | ±% | |
---|---|---|---|---|---|
Conservative | Howard Francis Doe* | 3,606 | 22.1 | +2.5 | |
Conservative | David Royle* | 2,892 | 17.7 | −1.3 | |
Conservative | Leslie Alan Wicks* | 2,257 | 13.8 | −2.8 | |
UKIP | Jean Katherine Shirly Appleton | 1,817 | 11.1 | +7.2 | |
Labour | Gillian Valerie Pearson | 1,485 | 9.1 | −0.8 | |
UKIP | Susan Mary Marsh | 1,468 | 9.0 | N/A | |
Labour | Josh Henry Gray | 1,342 | 8.2 | −1.2 | |
Labour | Louwella Margaret Prenter | 1,037 | 6.4 | −1.0 | |
Independent | Mike Walters | 249 | 1.5 | N/A | |
TUSC | Susan Mason-Saunders | 177 | 1.1 | N/A | |
Majority | 440 | 2.7 | |||
Turnout | 16,330 | ||||
Conservative hold | Swing | ||||
Conservative hold | Swing |
Party | Candidate | Votes | % | ±% | |
---|---|---|---|---|---|
Conservative | Andrew Mackness* | 1,698 | 24.3 | −0.7 | |
Conservative | Habib Odunlamin Sulaiman Tejan | 1,354 | 19.3 | −7.5 | |
Labour | John Alun Charles Jones | 1,033 | 14.8 | −7.0 | |
Labour | Mark William Edwin Jones | 1,001 | 14.3 | −1.5 | |
UKIP | Chris Spalding | 863 | 12.3 | N/A | |
UKIP | June Winton | 626 | 8.9 | N/A | |
Green | Michael Edward Phillips | 365 | 5.2 | +2.2 | |
TUSC | Naomi Catherine Sayers | 62 | 0.9 | N/A | |
Majority | 321 | 4.5 | |||
Turnout | 7,002 | ||||
Conservative hold | Swing | ||||
Conservative hold | Swing |
Party | Candidate | Votes | % | ±% | |
---|---|---|---|---|---|
Labour | Teresa Margaret Murray* | 1,861 | 20.7 | −10.0 | |
Labour | Nick Bowler* | 1,721 | 19.2 | −10.7 | |
Conservative | Sean Michael Varnham | 1,406 | 15.6 | −0.7 | |
UKIP | Chris Irvine | 1,209 | 13.4 | N/A | |
Conservative | Mohamed Rizvi Rawoof | 1,095 | 12.2 | −0.5 | |
UKIP | Trevor James Shields | 1,039 | 11.6 | N/A | |
Green | William James Davies | 560 | 6.2 | +1.2 | |
TUSC | Daniel Burn | 98 | 1.1 | N/A | |
Majority | 315 | 3.6 | |||
Turnout | 8,989 | ||||
Labour hold | Swing | ||||
Labour hold | Swing |
Party | Candidate | Votes | % | ±% | |
---|---|---|---|---|---|
Conservative | Trevor Anthony Clarke* | 2,984 | 15.6 | −5.1 | |
Conservative | Sylvia Mary Griffin* | 2,679 | 14.0 | −4.6 | |
Conservative | Rupert David Fearon Turpin* | 2,604 | 13.6 | −2.4 | |
UKIP | Keith Fletcher | 1,885 | 9.9 | +5.4 | |
UKIP | Alan William Collins | 1,666 | 8.7 | N/A | |
UKIP | Frank Moreton | 1,662 | 8.7 | N/A | |
Labour | Del Munton | 1,617 | 8.5 | −2.3 | |
Labour | Elaine Thomas | 1,431 | 7.5 | −2.5 | |
Labour | Joe Murray | 1,405 | 7.3 | −2.9 | |
Green | Bernard Edward Hyde | 576 | 3.0 | −0.1 | |
Liberal Democrats | Viv Parker | 502 | 2.6 | −1.6 | |
TUSC | Emma Sarah White | 116 | 0.6 | −1.3 | |
Majority | 719 | 3.7 | |||
Turnout | 19,127 | ||||
Conservative hold | Swing | ||||
Conservative hold | Swing |
Party | Candidate | Votes | % | ±% | |
---|---|---|---|---|---|
Conservative | Kelly Tolhurst* | 2,418 | 23.9 | −4.2 | |
Conservative | Stuart Albert Tranter | 1,884 | 18.6 | −9.5 | |
Labour | Rachel Catherine Garrick | 1,169 | 11.6 | −5.9 | |
UKIP | Helen Knight | 1,131 | 11.2 | N/A | |
UKIP | Stephen Knight | 1,066 | 10.5 | N/A | |
Labour | Tony John Scudder | 1,054 | 10.4 | −4.0 | |
Green | Clive Byrn Malcolm Gregory | 575 | 5.7 | −0.9 | |
Green | David Fredrick John Heritage | 405 | 4.0 | −0.5 | |
Liberal Democrats | Ken Juby | 206 | 2.0 | −2.2 | |
Liberal Democrats | Nem Juby | 142 | 1.4 | −1.9 | |
TUSC | Riven Gray | 65 | 0.7 | N/A | |
Majority | 715 | 7.0 | |||
Turnout | 10,115 | ||||
Conservative hold | Swing | ||||
Conservative hold | Swing |
Party | Candidate | Votes | % | ±% | |
---|---|---|---|---|---|
Conservative | Elizabeth Jane Chitty* | 2,673 | 15.1 | −2.3 | |
Conservative | Stephen Ian Richard Iles | 2,230 | 12.6 | −4.6 | |
Conservative | Phil Hall | 2,138 | 12.1 | −2.6 | |
Labour | Stephen Alan Hubbard* | 1,841 | 10.4 | −4.9 | |
UKIP | Ray Banks | 1,791 | 10.1 | N/A | |
Labour | Gareth Wilf Batts | 1,636 | 9.3 | −2.7 | |
UKIP | Paul O'Rouke | 1,630 | 9.2 | N/A | |
Labour | Linda Beatrice Robson | 1,500 | 8.5 | −4.3 | |
UKIP | Paul Rai | 1,413 | 8.0 | N/A | |
Green | Stephen William Dyke | 630 | 3.6 | N/A | |
TUSC | Sue Berry | 195 | 1.1 | −0.7 | |
Majority | 297 | 1.7 | |||
Turnout | 17,677 | ||||
Conservative gain from Labour | Swing | ||||
Conservative hold | Swing | ||||
Conservative hold | Swing |
Party | Candidate | Votes | % | ±% | |
---|---|---|---|---|---|
Conservative | John Williams | 3,015 | 14.9 | −4.7 | |
Conservative | Peter Martin Hicks* | 2,828 | 14.0 | −5.4 | |
Conservative | Gary David James Etheridge | 2,737 | 13.5 | −3.2 | |
UKIP | Ben Cook | 2,582 | 12.8 | N/A | |
UKIP | Tom Mason* | 2,475 | 12.2 | N/A | |
UKIP | Peter Rodberg* | 2,294 | 11.4 | N/A | |
Labour | Julia Hawkins | 1,278 | 6.3 | −3.3 | |
Labour | Avril Margaret Sime | 1,144 | 5.7 | −2.3 | |
Labour | Jim Wyper | 934 | 4.6 | −2.8 | |
Liberal Democrats | Vanessa Ann Roach | 421 | 2.1 | −1.1 | |
Liberal Democrats | Andrew Lawrence Millsom | 349 | 1.7 | −1.4 | |
TUSC | Rosilla Jane Ellwood | 165 | 0.8 | N/A | |
Majority | 155 | 0.7 | |||
Turnout | 20,222 | ||||
Conservative hold | Swing | ||||
Conservative hold | Swing |
Party | Candidate | Votes | % | ±% | |
---|---|---|---|---|---|
UKIP | Catriona Brown-Reckless | 2,527 | 14.5 | N/A | |
Conservative | John Fernley Nicholas Avey* | 2,289 | 13.1 | −3.3 | |
UKIP | Mark Paul Joy | 2,203 | 12.6 | N/A | |
Conservative | Josie Iles* | 2,085 | 12.0 | −2.7 | |
UKIP | Richard Thorne | 1,898 | 10.9 | N/A | |
Conservative | Harold Ogunfemi | 1,734 | 9.9 | −3.9 | |
Labour | Rob Heathfield | 1,583 | 9.1 | −5.4 | |
Labour | Ikechukwu Isaac Igwe | 1,576 | 9.0 | −6.2 | |
Labour | Harinder Singh Mahil | 1,411 | 8.1 | −6.3 | |
TUSC | Alec David Price | 141 | 0.8 | N/A | |
Majority | 118 | 0.6 | |||
Turnout | 17,447 | ||||
UKIP gain from Labour | Swing | ||||
UKIP gain from Conservative | Swing | ||||
Conservative hold | Swing |
Party | Candidate | Votes | % | ±% | |
---|---|---|---|---|---|
Labour | Dorte Marianne Gilry* | 2,547 | 16.9 | −0.5 | |
Labour | Glyn David Griffiths* | 2,353 | 15.6 | −1.2 | |
Conservative | Anne-Claire Marie Andree Howard | 2,287 | 15.2 | +3.7 | |
Conservative | Diana Marion Lawrence | 2,214 | 14.7 | +1.2 | |
Labour | Mark Prenter | 1,960 | 13.0 | −5.1 | |
Conservative | Tony Rocco | 1,700 | 11.2 | −1.2 | |
Green | Rebecca Jane Lehmann | 623 | 4.1 | +1.5 | |
Liberal Democrats | Veronica Anne Lewis | 434 | 2.9 | 0 | |
Liberal Democrats | Sheila Veronica Rose Kearney | 432 | 2.9 | +0.5 | |
Liberal Democrats | David Alfred McDonnell | 268 | 1.8 | −0.6 | |
TUSC | Ivor Andrew Lindsey Riddell | 257 | 1.7 | N/A | |
Majority | 73 | 0.5 | |||
Turnout | 15,075 | ||||
Conservative gain from Labour | Swing | ||||
Labour hold | Swing | ||||
Labour hold | Swing |
Party | Candidate | Votes | % | ±% | |
---|---|---|---|---|---|
Conservative | David Frederick Brake* | 2,445 | 30.0 | +6.4 | |
Conservative | Adrian Victor Henry Gulvin* | 2,097 | 25.7 | +6.9 | |
UKIP | Linda Veronica Russell | 1,211 | 14.8 | N/A | |
Labour | Eddie Peake | 1,024 | 12.6 | +3.6 | |
Labour | Robert Lee Pitt | 897 | 11.0 | +2.9 | |
Liberal Democrats | Jim Percy | 370 | 4.5 | +2.3 | |
TUSC | Liz Robinson | 111 | 1.4 | N/A | |
Majority | 886 | 10.9 | |||
Turnout | 8,155 | ||||
Conservative hold | Swing | ||||
Conservative hold | Swing |
Party | Candidate | Votes | % | ±% | |
---|---|---|---|---|---|
Conservative | Wendy Purdy | 2,070 | 24.6 | +6.8 | |
Conservative | Asha Rani Rita Saroy | 1,632 | 19.4 | +2.0 | |
Liberal Democrats | Diana Mary Smith* | 1,180 | 14.1 | −7.6 | |
Labour | Benjamin Pranczke | 1,030 | 12.3 | −0.5 | |
Labour | Raja Miah | 1,017 | 12.1 | −2.1 | |
Liberal Democrats | Paul Chaplin | 877 | 10.4 | −6.7 | |
Green | Richard James Lehmann | 437 | 5.2 | N/A | |
TUSC | Avril Eleene Roberts | 161 | 1.9 | N/A | |
Majority | 452 | 5.3 | |||
Turnout | 8,404 | ||||
Conservative gain from Liberal Democrats | Swing | ||||
Conservative hold | Swing |
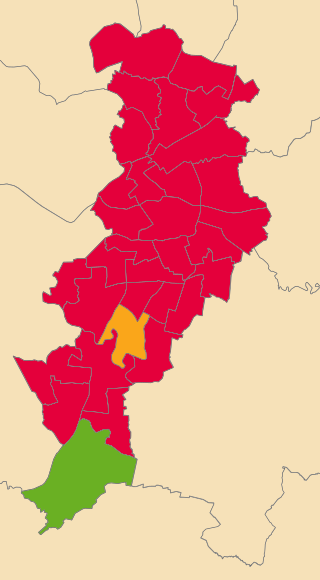
Elections to the Borough Council in Slough, England, were held on 3 May 2007. One third of the council was up for election. This was the 122nd Slough general local authority election since Slough became a local government unit in 1863.
The 2011 Carlisle City Council election took place on 5 May 2011 to elect members of Carlisle District Council in Cumbria, England. One third of the council was up for election and the council stayed under no overall control.
2012 Elections to East Lothian Council were held on 3 May 2012, on the same day as the other Scottish local government elections. The election used the 7 wards created as a result of the Local Governance (Scotland) Act 2004, with each ward electing three or four councillors using the single transferable vote system form of proportional representation, with 23 councillors elected.
The by-thirds 2015 Rotherham Metropolitan Borough Council election took place on Thursday 7 May 2015, to elect approximately one third of the members of the Rotherham Metropolitan Borough Council in England as part of the 2015 United Kingdom local elections held on the same day as the general election. All seats contested at this election were last contested in 2011, and of these, 20 were held by Labour Party councillors.
The 2015 Cheshire West and Chester Council election took place on 7 May 2015, electing members of Cheshire West and Chester Council in England. This was on the same day as other local elections across the country as well as the general election.
A by-thirds Hyndburn Borough Council local election took place on 7 May 2015. Approximately one third of the second tier council's 35 seats fell up for election, and the General Election was held on the same day.
Elections to Cannock Chase District Council took place on 7 May 2015 on the same day as other local elections in England as well as a general election. A third of the council was up for election, meaning a total of 15 councillors were elected from all of the council's wards.
The 2015 Colchester Borough Council election took place on 7 May 2015 to elect one third of the members of Colchester Borough Council in England. This was the same day as other local elections and as the General Election. Colchester Borough Council is made up of 60 councillors: 20 councillors were up for election.
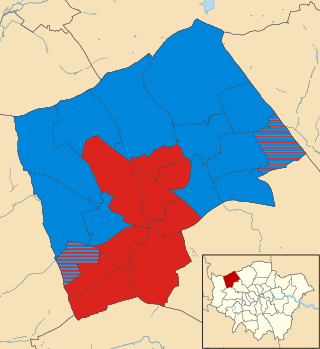
The 2014 West Oxfordshire District Council election took place on 22 May 2014 to elect members of West Oxfordshire District Council in Oxfordshire, England. One third of the council was up for election and the Conservative Party stayed in overall control of the council.
Elections to Manchester City Council were held on 2 May 2019, as part of the 2019 United Kingdom local elections. In 2018 Labour retained its majority of the council with 94 seats to the Liberal Democrats making up the opposition of 2, led by former MP John Leech.
Elections to Southampton City Council took place on Thursday 2 May 2019, alongside other local elections across the country. The Labour Party held a narrow majority of two at the last election and the seats contested in this election were last contested in 2015. Labour were defending 6 seats, the Conservatives were defending 8, whilst independent councillors, who held two seats, were not standing re-elections. Following a by-election in the Coxford ward where Labour gained the seat formerly held by an independent.
The 2022 Hackney London Borough Council election took place on 5 May 2022. All 57 members of Hackney London Borough Council were up for election. The elections took place alongside the election for the mayor of Hackney, local elections in the other London boroughs, and elections to local authorities across the United Kingdom.
The 2022 Harrow London Borough Council election took place on 5 May 2022. All 55 members of Harrow London Borough Council were elected. The elections took place alongside local elections in the other London boroughs and elections to local authorities across the United Kingdom.
The 2022 Manchester City Council election took place on 5 May 2022. One third of councillors on Manchester City Council were elected. This election was a part of the other local elections across the United Kingdom.
Elections to The Highland Council were held on 5 May 2022, the same day as the 31 other Scottish local government elections. As with other Scottish council elections, it was held using single transferable vote (STV) – a form of proportional representation – in which multiple candidates are elected in each ward and voters rank candidates in order of preference.
Elections to South Lanarkshire Council took place on 5 May 2022 on the same day as the 31 other Scottish local government elections. As with other Scottish council elections, it was held using single transferable vote (STV) – a form of proportional representation – in which multiple candidates are elected in each ward and voters rank candidates in order of preference.
Elections to North Ayrshire Council took place on 5 May 2022 on the same day as the 31 other Scottish local government elections. As with other Scottish council elections, it was held using single transferable vote (STV) – a form of proportional representation – in which multiple candidates are elected in each ward and voters rank candidates in order of preference.
Elections to Argyll and Bute Council took place on 5 May 2022, the same day as the 31 other Scottish local government elections. As with other Scottish council elections, it was held using single transferable vote (STV)—a form of proportional representation—in which multiple candidates are elected in each ward and voters rank candidates in order of preference. New ward boundaries were proposed by Boundaries Scotland in 2021, which would have reduced the total number of councillors to 34. However, these were rejected by the Scottish Parliament and the boundaries used at the previous election remained in place.
Elections to Fife Council took place on 5 May 2022 on the same day as the 31 other Scottish local government elections. As with other Scottish council elections, it was held using single transferable vote (STV) – a form of proportional representation – in which multiple candidates are elected in each ward and voters rank candidates in order of preference.
Elections to Aberdeen City Council took place on 5 May 2022 on the same day as the 31 other Scottish local government elections. As with other Scottish council elections, it was held using single transferable vote (STV) – a form of proportional representation – in which multiple candidates are elected in each ward and voters rank candidates in order of preference.