
Swale is a local government district with borough status in Kent, England. The council is based in Sittingbourne, the borough's largest town. The borough also contains the towns of Faversham, Queenborough and Sheerness, along with numerous villages and surrounding rural areas. It includes the Isle of Sheppey and is named after The Swale, the narrow channel which separates Sheppey from the mainland part of the borough. Some southern parts of the borough lie within the Kent Downs, a designated Area of Outstanding Natural Beauty.

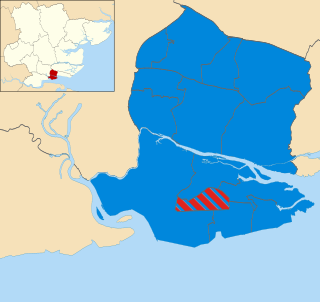
One third of Castle Point Borough Council in Essex, England is elected each year, followed by one year without election. Until 2003 the whole council was elected every four years. Since the last boundary changes in 2003, 41 councillors have been elected from 14 wards.

St Helens Metropolitan Borough Council elections are held every four years. St Helens Metropolitan Borough Council, which styles itself St Helens Borough Council, is the local authority for the metropolitan borough of St Helens in Merseyside, England. Since the last boundary changes in 2022, 48 councillors have been elected from 18 wards. Prior to the 2022 boundary changes, elections were held three years out of every four, with a third of the council being elected each time.

The 2003 Havant Borough Council election took place on 1 May 2003 to elect members of Havant Borough Council in Hampshire, England. One third of the council was up for election and the Conservative Party stayed in overall control of the council.
The 1999 Castle Point Borough Council election took place on 6 May 1999 to elect members of Castle Point Borough Council in Essex, England. The whole council was up for election and the Labour party stayed in overall control of the council.
The 2003 Castle Point Borough Council election took place on 1 May 2003 to elect members of Castle Point Borough Council in Essex, England. The whole council was up for election after boundary changes increased the number of seats by 2. The Conservative party gained overall control of the council from the Labour party.

The 2006 Brent London Borough Council election took place on 4 May 2006 to elect members of Brent London Borough Council in London, England. The whole council was up for election and the Labour Party lost overall control of the council to no overall control.

Swale Borough Council elections are held every four years to elect Swale Borough Council in Kent, England. Since the last boundary changes in 2015 the council has comprised 47 councillors representing 24 wards. Until 2011 one third of the council was elected every year, followed by one year without election.
The 1998 Swale Borough Council election took place on 7 May 1998 to elect members of Swale Borough Council in Kent, England. One third of the council was up for election and the council remained under no overall control.
The 1999 Swale Borough Council election took place on 6 May 1999 to elect members of Swale Borough Council in Kent, England. One third of the council was up for election and the council remained under no overall control.
The 2000 Swale Borough Council election took place on 4 May 2000 to elect members of Swale Borough Council in Kent, England. One third of the council was up for election and the council remained under no overall control.

The 2002 Swale Borough Council election took place on 2 May 2002 to elect members of Swale Borough Council in Kent, England. The whole council was up for election with boundary changes since the last election in 2000 reducing the number of seats by two. The Conservative Party gained overall control of the council from no overall control.

The 2004 Swale Borough Council election took place on 10 June 2004 to elect members of Swale Borough Council in Kent, England. One third of the council was up for election and the Conservative Party stayed in overall control of the council.

The 2006 Swale Borough Council election took place on 4 May 2006 to elect members of Swale Borough Council in Kent, England. One third of the council was up for election and the Conservative Party stayed in overall control of the council.

The 2007 Swale Borough Council election took place on 3 May 2007 to elect members of Swale Borough Council in Kent, England. One third of the council was up for election and the Conservative Party stayed in overall control of the council.
The 2008 Swale Borough Council election took place on 1 May 2008 to elect members of Swale Borough Council in Kent, England. One third of the council was up for election and the Conservative Party stayed in overall control of the council.

The 2010 Swale Borough Council election took place on 6 May 2010 to elect members of Swale Borough Council in Kent, England. One third of the council was up for election and the Conservative Party stayed in overall control of the council.
The 2011 Swale Borough Council election took place on 5 May 2011 to elect members of Swale Borough Council in Kent, England. The whole council was up for election and the Conservative Party stayed in overall control of the council.
An election was held to Swale Borough Council in England as part of the United Kingdom local elections on 7 May 2015. All 47 seats were up for election under new ward boundaries.

The 2007 Christchurch Borough Council election took place on 3 May 2007 to elect members of Christchurch Borough Council in Dorset, England. The whole council was up for election and the Conservative party stayed in overall control of the council.
