The 2003 Waveney Council election took place on 1 May 2003 to elect members of Waveney District Council in Suffolk, England. One third of the council was up for election and the council stayed under no overall control. [1]
After the election, the composition of the council was:
2003 Waveney District Council election [3] | ||||||||||
---|---|---|---|---|---|---|---|---|---|---|
Party | This election | Full council | This election | |||||||
Seats | Net | Seats % | Other | Total | Total % | Votes | Votes % | +/− | ||
Conservative | 8 | 50.0 | 13 | 21 | 43.8 | 7,420 | 37.4 | +5.6 | ||
Labour | 5 | 2 | 31.3 | 14 | 19 | 39.6 | 6,214 | 31.3 | -14.4 | |
Independent | 2 | 2 | 12.5 | 3 | 5 | 10.4 | 1,296 | 6.5 | +1.0 | |
Liberal Democrats | 1 | 6.3 | 2 | 3 | 6.3 | 3,230 | 16.3 | +2.2 | ||
Green | 0 | 0.0 | 0 | 0 | 0.0 | 1,361 | 6.9 | +5.2 | ||
UKIP | 0 | 0.0 | 0 | 0 | 0.0 | 258 | 1.3 | +0.8 | ||
Socialist Alliance | 0 | 0.0 | 0 | 0 | 0.0 | 59 | 0.3 | -0.3 | ||
Party | Candidate | Votes | % | ±% | |
---|---|---|---|---|---|
Conservative | Brian Woodruff | 540 | 33.7 | ||
Labour | Alan Thwaites | 468 | 29.2 | ||
UKIP | Brian Aylett | 258 | 16.1 | ||
Green | Graham Elliott | 185 | 11.5 | ||
Liberal Democrats | Frances Mitchell | 152 | 9.5 | ||
Majority | 72 | 4.5 | |||
Turnout | 1,603 | 41.2 | −0.4 | ||
Conservative gain from Labour | Swing | ||||
Party | Candidate | Votes | % | ±% | |
---|---|---|---|---|---|
Labour | Michael Adams | 373 | 40.5 | ||
Conservative | Neil Smith | 336 | 36.4 | ||
Liberal Democrats | Alison Briggs | 159 | 17.2 | ||
Green | Michael McGee | 54 | 5.9 | ||
Majority | 37 | 4.1 | |||
Turnout | 922 | 23.6 | −1.8 | ||
Labour hold | Swing | ||||
Party | Candidate | Votes | % | ±% | |
---|---|---|---|---|---|
Conservative | Wendy Mawer | 491 | 68.0 | −0.6 | |
Labour | Angela Turner | 115 | 15.9 | −15.5 | |
Liberal Democrats | David O'Neill | 58 | 8.0 | +8.0 | |
Green | Michael Platt | 58 | 8.0 | +8.0 | |
Majority | 376 | 52.1 | +14.9 | ||
Turnout | 722 | 41.2 | +0.5 | ||
Conservative hold | Swing | ||||
Party | Candidate | Votes | % | ±% | |
---|---|---|---|---|---|
Conservative | John Groom | 697 | 48.6 | ||
Labour | Lynn Derges | 419 | 29.2 | ||
Liberal Democrats | Wendy Curry | 173 | 12.1 | ||
Green | Simon Thompson | 144 | 10.0 | ||
Majority | 278 | 19.4 | |||
Turnout | 1,433 | 37.3 | −1.7 | ||
Conservative hold | Swing | ||||
Party | Candidate | Votes | % | ±% | |
---|---|---|---|---|---|
Conservative | Frank Mortimer | 501 | 58.1 | ||
Labour | Peter Shelley | 199 | 23.1 | ||
Liberal Democrats | Brian Howe | 133 | 15.4 | ||
Green | Emma Waller | 30 | 3.5 | ||
Majority | 302 | 35.0 | |||
Turnout | 863 | 24.0 | −1.0 | ||
Conservative hold | Swing | ||||
Party | Candidate | Votes | % | ±% | |
---|---|---|---|---|---|
Conservative | Kathleen Grant | 580 | 50.4 | ||
Labour | Paul Widdowson | 356 | 31.0 | ||
Liberal Democrats | John Marsden | 161 | 14.0 | ||
Green | Richard Vinton | 53 | 4.6 | ||
Majority | 224 | 19.4 | |||
Turnout | 1,150 | 21.8 | −4.4 | ||
Conservative hold | Swing | ||||
Party | Candidate | Votes | % | ±% | |
---|---|---|---|---|---|
Conservative | Robert Niblett | 684 | 49.6 | ||
Labour | Julie McLoughlin | 274 | 19.9 | ||
Green | Paul Whitlow | 270 | 19.6 | ||
Liberal Democrats | Henri Watts | 150 | 10.9 | ||
Majority | 410 | 29.7 | |||
Turnout | 1,378 | 35.8 | −6.1 | ||
Conservative hold | Swing | ||||
Party | Candidate | Votes | % | ±% | |
---|---|---|---|---|---|
Independent | Norman Keable | 575 | 38.4 | ||
Labour | Ian Graham | 412 | 27.5 | ||
Liberal Democrats | Jack Thain | 304 | 20.3 | ||
Conservative | James Fraser | 150 | 10.0 | ||
Green | Peter Taylor | 56 | 3.7 | ||
Majority | 163 | 10.9 | |||
Turnout | 1,497 | 26.8 | −6.3 | ||
Independent gain from Labour | Swing | ||||
Party | Candidate | Votes | % | ±% | |
---|---|---|---|---|---|
Liberal Democrats | Gifford Baxter | 710 | 51.2 | ||
Labour | Josette Bellham | 416 | 30.0 | ||
Conservative | Paul Kimble | 178 | 12.8 | ||
Green | Maxine Narburgh | 82 | 5.9 | ||
Majority | 294 | 21.2 | |||
Turnout | 1,386 | 25.5 | −8.0 | ||
Liberal Democrats hold | Swing | ||||
Party | Candidate | Votes | % | ±% | |
---|---|---|---|---|---|
Labour | David Thomas | 467 | 39.4 | ||
Conservative | Dorothy Blenkinsopp | 405 | 34.1 | ||
Liberal Democrats | Andrew Thomas | 190 | 16.0 | ||
Green | Stephen Sizer | 65 | 5.5 | ||
Socialist Alliance | Nicholas Bird | 59 | 5.0 | ||
Majority | 62 | 5.3 | |||
Turnout | 1,186 | 21.8 | −5.5 | ||
Labour hold | Swing | ||||
Party | Candidate | Votes | % | ±% | |
---|---|---|---|---|---|
Independent | Peter Collecott | 461 | 43.3 | ||
Labour | Marie Rodgers | 289 | 27.2 | ||
Conservative | Andrew Borrett | 274 | 25.8 | ||
Green | Diana Whiting | 40 | 3.8 | ||
Majority | 172 | 16.1 | |||
Turnout | 1,064 | 32.2 | −3.0 | ||
Independent gain from Conservative | Swing | ||||
Party | Candidate | Votes | % | ±% | |
---|---|---|---|---|---|
Labour | Stephen Barrett | 782 | 43.4 | ||
Conservative | Marcus Ardley | 562 | 31.2 | ||
Liberal Democrats | Lorraine Lakes | 362 | 20.1 | ||
Green | Melanie Harrison | 96 | 5.3 | ||
Majority | 220 | 12.2 | |||
Turnout | 1,802 | 32.8 | −4.2 | ||
Labour hold | Swing | ||||
Party | Candidate | Votes | % | ±% | |
---|---|---|---|---|---|
Labour | Rosemary Winterton | 626 | 43.5 | ||
Conservative | John Burford | 540 | 37.5 | ||
Liberal Democrats | Patricia Anderson | 202 | 14.0 | ||
Green | Colin Boor | 71 | 4.9 | ||
Majority | 86 | 6.0 | |||
Turnout | 1,439 | 25.0 | −4.0 | ||
Labour hold | Swing | ||||
Party | Candidate | Votes | % | ±% | |
---|---|---|---|---|---|
Labour | Catherine Barrett | 654 | 40.8 | ||
Conservative | Barry Bee | 421 | 26.3 | ||
Independent | Reginald Allen | 260 | 16.2 | ||
Liberal Democrats | Sandra Tonge | 209 | 13.1 | ||
Green | James Stoddart | 57 | 3.6 | ||
Majority | 233 | 14.5 | |||
Turnout | 1,601 | 27.5 | −4.2 | ||
Labour hold | Swing | ||||
Party | Candidate | Votes | % | ±% | |
---|---|---|---|---|---|
Conservative | Kenneth Sale | 691 | 56.7 | ||
Labour | Michael Turner | 278 | 22.8 | ||
Liberal Democrats | Philip Mitchell | 193 | 15.8 | ||
Green | Nicola Elliott | 57 | 4.7 | ||
Majority | 413 | 33.9 | |||
Turnout | 1,219 | 34.5 | −7.0 | ||
Conservative hold | Swing | ||||
Party | Candidate | Votes | % | ±% | |
---|---|---|---|---|---|
Conservative | John Goldsmith | 370 | 64.6 | ||
Labour | Jack Seal | 86 | 15.0 | ||
Liberal Democrats | Nicholas Bromley | 74 | 12.9 | ||
Green | Ray Cameron-Goodman | 43 | 7.5 | ||
Majority | 284 | 49.6 | |||
Turnout | 573 | 32.6 | −1.3 | ||
Conservative hold | Swing | ||||
Party | Candidate | Votes | % | ±% | |
---|---|---|---|---|---|
Conservative | 463 | 39.3 | +3.1 | ||
Labour | 417 | 35.4 | −16.5 | ||
Liberal Democrats | 297 | 25.2 | +13.3 | ||
Majority | 46 | 3.9 | N/A | ||
Turnout | 1,177 | ||||
Conservative gain from Labour | Swing | 10.0 | |||
Lowestoft is a coastal town and civil parish in the East Suffolk district of Suffolk, England. As the most easterly UK settlement, it is 38 miles (61 km) north-east of Ipswich and 22 miles (35 km) south-east of Norwich, and the main town in its district. The estimated population in the built-up area exceeds 70,000. Its development grew with the fishing industry and as a seaside resort with wide sandy beaches. As fishing declined, oil and gas exploitation in the North Sea in the 1960s took over. While these too have declined, Lowestoft is becoming a regional centre of the renewable energy industry.
Waveney was a local government district in Suffolk, England, named after the River Waveney that formed its north-east border. The district council was based in Lowestoft, the major settlement in Waveney. The other towns in the district were Beccles, Bungay, Halesworth and Southwold.
Suffolk Coastal is a parliamentary constituency in the county of Suffolk, England, which has been represented in the House of Commons of the UK Parliament since 2024 by Jenny Riddell-Carpenter, a Labour Party Member of Parliament (MP).
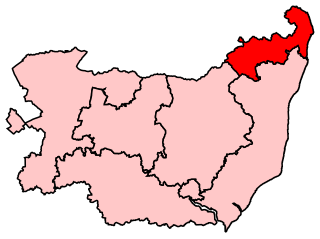
Waveney was a constituency of in the House of Commons of the UK Parliament that existed from 1983 to 2024. It returned one Member of Parliament (MP) to the House of Commons of the Parliament of the United Kingdom.
Adrian Philip Ramsay is a British politician who has served as co-leader of the Green Party of England and Wales since 2021 and as the Member of Parliament for Waveney Valley since 2024. He was previously the deputy leader of the Green Party of England and Wales from 2008 to 2012. He served as a Norwich City Councillor from 2003 to 2011. He worked as chief executive of the Centre for Alternative Technology from 2014 to 2019 and from 2019 to 2024 was CEO of MCS Charitable Foundation.
Local elections were held in Waveney district every four years to elect councillors to Waveney District Council. In the past, one-third of councillors were elected each year, but in 2010 the council opted to change to a whole council election system. Since the last boundary changes in 2002, 48 councillors have been elected from 23 wards. The district was merged with Suffolk Coastal in April 2019 to form East Suffolk, meaning that the 2015 elections were the final Waveney elections to be held.
The 1999 Waveney Council election took place on 6 May 1999 to elect members of Waveney District Council in Suffolk, England. One third of the council was up for election and the Labour Party stayed in overall control of the council.
The 2000 Waveney Council election took place on 4 May 2000 to elect members of Waveney District Council in Suffolk, England. One third of the council was up for election and the Labour Party stayed in overall control of the council.
The 2002 Waveney Council election took place on 2 May 2002 to elect members of Waveney District Council in Suffolk, England. The whole council was up for election with boundary changes since the last election in 2000. The Labour Party lost overall control of the council to no overall control.
The 2004 Waveney Council election took place on 10 June 2004 to elect members of Waveney District Council in Suffolk, England. One third of the council was up for election and the council stayed under no overall control.
Elections to Waveney District Council took place on Thursday 5 May 2011. This was the first election held as a Whole Council election following a change made to the electoral system in 2010. As a result, all 48 council seats were contested.
The 2015 Waveney District Council election was held on 7 May 2015 to elect all 48 members of Waveney District Council in England. This was on the same day as other local elections.
The 1991 Waveney District Council election took place on 2 May 1991 to elect members of Waveney District Council in England. This was on the same day as other local elections.
The 1992 Waveney District Council election took place on 7 May 1992 to elect members of Waveney District Council in England. This was on the same day as other local elections.
The 1994 Waveney District Council election took place on 5 May 1994 to elect members of Waveney District Council in England. This was on the same day as other local elections.
The 1996 Waveney District Council election took place on 7 May 1996 to elect members of Waveney District Council in England. This was on the same day as other local elections.
The 2006 Waveney District Council election took place on 4 May 2006 to elect members of Waveney District Council in England. This was on the same day as other local elections.
The 2007 Waveney District Council election took place on 3 May 2007 to elect members of Waveney District Council in England. This was on the same day as other local elections.
The 2008 Waveney District Council election took place on 1 May 2008 to elect members of Waveney District Council in England. This was on the same day as other local elections.
The 2010 Waveney District Council election took place on 6 May 2010 to elect members of Waveney District Council in England. This was on the same day as other local elections.