Results maps
 2002 results map
 2003 results map
 2004 results map
 2006 results map
 2007 results map
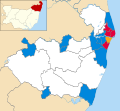 2008 results map
 2010 results map
 2011 results map
 2015 results map
Local elections were held in Waveney district every four years to elect councillors to Waveney District Council. In the past, one-third of councillors were elected each year, but in 2010 the council opted to change to a whole council election system. [1] Since the last boundary changes in 2002, 48 councillors have been elected from 23 wards. The district was merged with Suffolk Coastal in April 2019 to form East Suffolk, meaning that the 2015 elections were the final Waveney elections to be held. [2]
From the first election to the council in 1973 until its abolition in 2019, political control of the council was held by the following parties: [3] [4]
| Party in control | Years | |
|---|---|---|
| No overall control | 1973–1976 | |
| Conservative | 1976–1986 | |
| No overall control | 1986–1990 | |
| Labour | 1990–2002 | |
| No overall control | 2002–2006 | |
| Conservative | 2006–2011 | |
| No overall control | 2011–2015 | |
| Conservative | 2015–2019 | |
The leaders of the council from 2003 until its abolition in 2019 were:
| Councillor | Party | From | To | |
|---|---|---|---|---|
| Brian Hunter [5] | Labour | May 2003 | ||
| Peter Austin [6] | Conservative | 15 May 2003 | 13 Jun 2004 | |
| Mark Bee [7] | Conservative | 24 Jun 2004 | 25 May 2011 | |
| Colin Law [8] [9] | Conservative | 25 May 2011 | May 2017 | |
| Mark Bee [10] [11] | Conservative | 17 May 2017 | 31 Mar 2019 | |
| Year | Conservative | Labour | Liberal Democrats [a] | Green | Independents & Others | Council control after election | ||
|---|---|---|---|---|---|---|---|---|
| Local government reorganisation; council established (57 seats) | ||||||||
| 1973 | 22 | 27 | 5 | – | 3 | No overall control | ||
| 1976 | 39 | 13 | 4 | 0 | 1 | Conservative | ||
| 1979 | 32 | 17 | 3 | 0 | 5 | Conservative | ||
| 1980 | 32 | 17 | 3 | 0 | 5 | Conservative | ||
| 1982 | 32 | 17 | 3 | 0 | 5 | Conservative | ||
| New ward boundaries (48 seats) [13] | ||||||||
| 1983 | 27 | 17 | 2 | 0 | 2 | Conservative | ||
| 1984 | 26 | 19 | 2 | 0 | 1 | Conservative | ||
| 1986 | 23 | 21 | 3 | 0 | 1 | No overall control | ||
| 1987 | 22 | 21 | 4 | 0 | 1 | No overall control | ||
| 1988 | 23 | 20 | 4 | 0 | 1 | No overall control | ||
| 1990 | 16 | 27 | 4 | 0 | 1 | Labour | ||
| 1991 | 14 | 27 | 6 | 0 | 1 | Labour | ||
| 1992 | 17 | 26 | 5 | 0 | 0 | Labour | ||
| 1994 | 17 | 27 | 4 | 0 | 0 | Labour | ||
| 1995 | 10 | 36 | 2 | 0 | 0 | Labour | ||
| 1996 | 2 | 44 | 2 | 0 | 0 | Labour | ||
| 1998 | 3 | 41 | 2 | 0 | 2 | Labour | ||
| 1999 | 5 | 38 | 3 | 0 | 2 | Labour | ||
| 2000 | 13 | 28 | 4 | 0 | 3 | Labour | ||
| New ward boundaries (48 seats) [14] [15] [16] | ||||||||
| 2002 | 21 | 21 | 3 | 0 | 3 | No overall control | ||
| 2003 | 21 | 20 | 3 | 0 | 4 | No overall control | ||
| 2004 | 24 | 14 | 3 | 0 | 7 | No overall control | ||
| 2006 | 29 | 12 | 3 | 0 | 4 | Conservative | ||
| 2007 | 30 | 12 | 3 | 1 | 2 | Conservative | ||
| 2008 | 30 | 12 | 3 | 1 | 2 | Conservative | ||
| 2010 | 29 | 15 | 2 | 1 | Conservative | |||
| New ward boundaries (48 seats) | ||||||||
| 2011 | 23 | 23 | 0 | 1 | 1 | No overall control | ||
| 2015 | 27 | 20 | 0 | 1 | 0 | Conservative | ||


| Party | Candidate | Votes | % | ±% | |
|---|---|---|---|---|---|
| Conservative | 463 | 39.3 | +3.1 | ||
| Labour | 417 | 35.4 | −16.5 | ||
| Liberal Democrats | 297 | 25.2 | +13.3 | ||
| Majority | 46 | 3.9 | |||
| Turnout | 1,177 | ||||
| Conservative gain from Labour | Swing | ||||
| Party | Candidate | Votes | % | ±% | |
|---|---|---|---|---|---|
| Conservative | Norman Brooks | 708 | 45.9 | −7.1 | |
| Labour | Sylvia Robbins | 586 | 38.0 | +4.8 | |
| Green | Sue Bergin | 137 | 8.9 | −5.0 | |
| UKIP | Stuart Foulger | 64 | 4.1 | +4.1 | |
| Liberal Democrats | Doug Farmer | 48 | 3.1 | +3.1 | |
| Majority | 122 | 7.9 | |||
| Turnout | 1,543 | ||||
| Conservative hold | Swing | ||||
| Party | Candidate | Votes | % | ±% | |
|---|---|---|---|---|---|
| Conservative | Graham Catchpole | 520 | 39.6 | +12.3 | |
| Green | Nicky Elliott | 390 | 29.7 | +15.0 | |
| Labour | Alan Green | 369 | 28.1 | −5.3 | |
| Liberal Democrats | Doug Farmer | 35 | 2.7 | +2.7 | |
| Majority | 130 | 9.9 | |||
| Turnout | 1,314 | ||||
| Conservative gain from Labour | Swing | ||||
| Party | Candidate | Votes | % | ±% | |
|---|---|---|---|---|---|
| Labour | Janet Craig | 647 | 48.2 | +2.5 | |
| UKIP | Bertie Poole | 358 | 26.7 | +26.7 | |
| Conservative | Anthony Taylor | 217 | 16.2 | −7.5 | |
| Green | George Langley | 85 | 6.3 | −7.8 | |
| Liberal Democrats | Christopher Thomas | 36 | 2.7 | +2.7 | |
| Majority | 289 | 21.5 | |||
| Turnout | 1,343 | ||||
| Labour hold | Swing | ||||
| Party | Candidate | Votes | % | ±% | |
|---|---|---|---|---|---|
| Labour | Len Jacklin | 449 | 41.2 | +11.5 | |
| Conservative | Deanna Law | 329 | 30.2 | +2.2 | |
| UKIP | Bert Poole | 269 | 24.7 | +24.7 | |
| Green | Maxine Narburgh | 23 | 2.1 | −4.8 | |
| Liberal Democrats | Chris Thomas | 21 | 1.9 | −4.3 | |
| Majority | 120 | 11.0 | |||
| Turnout | 1,091 | ||||
| Labour hold | Swing | ||||
| Party | Candidate | Votes | % | ±% | |
|---|---|---|---|---|---|
| Conservative | Letitia Smith | 726 | 42.2 | −0.6 | |
| Labour | Tobias Walton | 535 | 31.1 | +3.7 | |
| Green | Jennifer Berry | 245 | 14.3 | −1.6 | |
| Independent | Jack Tyler | 213 | 12.4 | +12.4 | |
| Majority | 191 | 11.1 | |||
| Turnout | 1,719 | ||||
| Conservative hold | Swing | ||||
| Party | Candidate | Votes | % | ±% | |
|---|---|---|---|---|---|
| Conservative | Craig Rivett | 335 | 40.4 | −8.0 | |
| Labour | Paul Tyack | 252 | 30.4 | +11.6 | |
| UKIP | Andrew Bols | 156 | 18.8 | −4.3 | |
| Liberal Democrats | Chris Thomas | 46 | 5.5 | +5.5 | |
| Green | David Brambley-Crawshaw | 40 | 4.8 | −4.9 | |
| Majority | 83 | 10.0 | |||
| Turnout | 829 | ||||
| Conservative hold | Swing | ||||
| Party | Candidate | Votes | % | ±% | |
|---|---|---|---|---|---|
| Conservative | Keith Robinson | 527 | 50.2 | +8.8 | |
| Labour | Len Jacklin | 357 | 34.0 | +5.4 | |
| UKIP | Phillip Trindall | 112 | 10.7 | −11.1 | |
| Liberal Democrats | Chris Thomas | 54 | 5.1 | +5.1 | |
| Majority | 170 | 16.2 | |||
| Turnout | 1,050 | ||||
| Conservative hold | Swing | ||||
| Party | Candidate | Votes | % | ±% | |
|---|---|---|---|---|---|
| Labour | Peter Byatt | 374 | 47.8 | +12.2 | |
| Conservative | Gilly Gunner | 217 | 27.7 | +7.2 | |
| Liberal Democrats | Dominic Leslie | 84 | 10.7 | +10.7 | |
| UKIP | Phillip Trindall | 78 | 10.0 | −9.7 | |
| Green | Ben Quail | 30 | 3.8 | −5.2 | |
| Majority | 157 | 20.1 | |||
| Turnout | 783 | ||||
| Labour hold | Swing | ||||
| Party | Candidate | Votes | % | ±% | |
|---|---|---|---|---|---|
| Conservative | Linda Coulam | 487 | 41.7 | +11.8 | |
| Labour | Nasima Begum | 410 | 35.1 | −1.3 | |
| UKIP | Bernie Guymer | 119 | 10.2 | −15.8 | |
| Liberal Democrats | Shaun Waters | 88 | 7.5 | +7.5 | |
| Green | Baz Bemment | 65 | 5.6 | −2.2 | |
| Majority | 77 | 6.6 | |||
| Turnout | 1,169 | ||||
| Conservative gain from Labour | Swing | ||||
| Party | Candidate | Votes | % | ±% | |
|---|---|---|---|---|---|
| Conservative | Melanie Vigo di Gallidoro | 643 | 41.7 | +11.8 | |
| Labour | Paul Tyack | 600 | 40.9 | −5.2 | |
| UKIP | Phillip Trindall | 116 | 7.9 | +7.9 | |
| Green | Peter Lang | 64 | 4.4 | −8.3 | |
| Liberal Democrats | Adam Robertson | 44 | 3.0 | −6.0 | |
| Majority | 43 | 2.9 | |||
| Turnout | 1,467 | ||||
| Conservative gain from Labour | Swing | ||||
| Party | Candidate | Votes | % | ±% | |
|---|---|---|---|---|---|
| Liberal Democrats | David Beavan | 1,005 | 71.4 | +71.4 | |
| Conservative | David Burrows | 307 | 21.8 | −28.4 | |
| Labour | John Cracknell | 78 | 5.5 | −14.8 | |
| UKIP | Mike Shaw | 18 | 1.3 | −13.3 | |
| Majority | 698 | 49.6 | |||
| Turnout | 1,408 | ||||
| Liberal Democrats gain from Conservative | Swing | ||||