Results maps
 1979 results map
 1983 results map
 1987 results map
 1991 results map
 1995 results map
 1999 results map
 2003 results map
 2007 results map
 2011 results map
 2015 results map
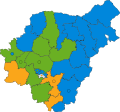 2019 results map
 2023 results map
Mid Suffolk District Council elections are held every four years to elect members of Mid Suffolk District Council in Suffolk, England. Since the last boundary changes in 2019, there have been 34 councillors elected from 26 wards. [1]
| Year | Conservative | Labour | Liberal Democrats [a] | Green | Independents & Others | Council control after election | ||
|---|---|---|---|---|---|---|---|---|
| Local government reorganisation; council established (40 seats) | ||||||||
| 1973 | 6 | 9 | 1 | – | 24 | Independent | ||
| 1976 | 13 | 6 | 2 | 0 | 19 | No overall control | ||
| New ward boundaries [2] | ||||||||
| 1979 | 15 | 5 | 2 | 0 | 18 | No overall control | ||
| 1983 | 19 | 6 | 1 | 0 | 14 | No overall control | ||
| 1987 | 19 | 6 | 4 | 0 | 11 | No overall control | ||
| 1991 | 17 | 8 | 10 | 0 | 5 | No overall control | ||
| 1995 | 6 | 17 | 12 | 0 | 4 | No overall control | ||
| 1999 | 15 | 6 | 14 | 0 | 5 | No overall control | ||
| New ward boundaries [3] [4] | ||||||||
| 2003 | 21 | 2 | 11 | 2 | 4 | Conservative | ||
| 2007 | 22 | 0 | 10 | 2 | 6 [b] | Conservative | ||
| 2011 | 22 | 1 | 6 | 4 | 7 [c] | Conservative | ||
| 2015 | 29 | 0 | 4 | 5 | 2 | Conservative | ||
| New ward boundaries; seats decreased from 40 to 34 [1] | ||||||||
| 2019 | 16 | 0 | 5 | 12 | 1 | No overall control | ||
| 2023 | 6 | 0 | 4 | 24 | 0 | Green | ||


A by-election occurs when seats become vacant between council elections. Below is a summary of by-elections from 1983 onwards. [5] Full by-election results are listed under the last regular election preceeding the by-election and can be found by clicking on the ward name.
| Ward | Date | Incumbent party | Winning party | ||
|---|---|---|---|---|---|
| Stonham | 22 May 1986 | Conservative | Conservative | ||
| Ringshall | 30 October 1986 | Conservative | Conservative | ||
| Palgrave | 19 May 1988 | Conservative | Conservative | ||
| Needham Market | 21 July 1988 | Conservative | Conservative | ||
| Onehouse | 15 September 1988 | SLD | SLD | ||
| Needham Market | 5 April 1990 | Conservative | Liberal Democrats | ||
| Stowmarket South | 5 July 1990 | Labour | Labour | ||
| Walsham-le-Willows | 4 February 1993 | Conservative | Conservative | ||
| Stowupland | 4 February 1993 | Conservative | Labour | ||
| Debenham | 30 September 1993 | Conservative | Liberal Democrats | ||
| Worlingworth | 20 October 1994 | Conservative | Independent | ||
| Ward | Date | Incumbent party | Winning party | ||
|---|---|---|---|---|---|
| Haughley & Wetherden | 13 July 1995 | Labour | Labour | ||
| Stowmarket Central | 2 May 1996 | Labour | Labour | ||
| Badwell Ash | 27 February 1997 | Independent | Conservative | ||
| Norton | 9 September 1999 | Conservative | Conservative | ||
| Mendlesham | 17 January 2002 | Conservative | Conservative | ||
| Elmswell | 21 March 2002 | Conservative | Liberal Democrats | ||
| Worlingworth | 23 January 2003 | Conservative | Conservative | ||
| Claydon & Barham | 21 October 2004 | Liberal Democrats | Liberal Democrats | ||
| Barking & Somersham | 21 October 2004 | Liberal Democrats | Liberal Democrats | ||
| Hoxne | 28 July 2005 | Conservative | Liberal Democrats | ||
| Bramford & Blakenham | 24 November 2005 | Conservative | Liberal Democrats | ||
| Ward | Date | Incumbent party | Winning party | ||
|---|---|---|---|---|---|
| Haughley & Wetherden | 25 March 2010 | Conservative | Green | ||
| Stowmarket North | 22 May 2014 | Conservative | Conservative | ||
| Barking & Somersham | 2 February 2016 | Conservative | Green | ||
| Eye | 4 May 2017 | Independent | Conservative | ||
| Ward | Date | Incumbent party | Winning party | ||
|---|---|---|---|---|---|
| Thurston | 17 February 2022 | Green | Green | ||
| Chilton | 2 May 2024 | Green | Green | ||
| Thurston | 24 September 2024 | Green | Conservative | ||
| Haughley, Stowupland & Wetherden | 12 June 2025 | Green | Green | ||