The 2015 Mid Suffolk District Council election took place on the 7 May 2015 to elect members of Mid Suffolk District Council in England. [1] It was held on same day as many UK local elections and the general election.
28 Conservative councillors became the governing group of the council (compared to 20-member minority administration with an opposition of 20 before the election) leaving 12 councillors in opposing groups. Conservatives and Greens made gains. Independents and Lib Dems sustained a net loss of five seats combined. Labour and Suffolk Together councillors lost their total of three seats. Two councillors (a Green and a Conservative) were re-elected by default as the only candidates nominated in the rural Haughley & Wetherden and Worlingworth wards respectively.
Mid Suffolk District Council Election, 2015 | ||||||||||
---|---|---|---|---|---|---|---|---|---|---|
Party | Candidates | Seats | Gains | Losses | Net gain/loss | Seats % | Votes % | Votes | +/− | |
Conservative | 34 | 29 | +8 | -1 | +7 | 70.0 | 51.2 | 33,387 | +12.3 | |
Green | 28 | 5 | +1 | 0 | +1 | 12.5 | 15.2 | 9,912 | +1.1 | |
Liberal Democrats | 16 | 4 | 0 | -2 | -2 | 10 | 13.4 | 8,708 | -7.2 | |
Independent | 4 | 2 | 0 | -3 | -3 | 5 | 4.0 | 2,401 | -3.1 | |
Labour | 8 | 0 | 0 | -1 | -1 | 0 | 6.4 | 4,123 | -5.8 | |
UKIP | 11 | 0 | 0 | 0 | 0 | 0 | 8.5 | 5,568 | +4.9 | |
Suffolk Together | 2 | 0 | 0 | -2 | -2 | 0 | 1.7 | 1,079 | -2.1 | |
Party | Candidate | Votes | % | ±% | |
---|---|---|---|---|---|
Conservative | Jill Wilshaw | 687 | 50.6 | +7.7 | |
Independent | Jacob Stringer | 670 | 49.4 | +0.5 | |
Majority | |||||
Turnout | |||||
Conservative gain from Independent | Swing | ||||
Party | Candidate | Votes | % | ±% | |
---|---|---|---|---|---|
Conservative | Roy Barker | 779 | 67.4 | -2.6 | |
Green | Andy Mellen | 382 | 24.0 | +7.6 | |
Liberal Democrats | Ann Gath | 137 | 8.6 | +0.6 | |
Majority | |||||
Turnout | |||||
Conservative hold | Swing | ||||
Party | Candidate | Votes | % | ±% | |
---|---|---|---|---|---|
Conservative | David Card | 542 | 41.7 | +8.1 | |
Suffolk Together | Stephen Wright | 411 | 31.6 | -21.8 | |
UKIP | Melanie Combstock | 194 | 14.9 | +14.9 | |
Liberal Democrats | Paul Thomas | 154 | 11.8 | -1.3 | |
Majority | |||||
Turnout | |||||
Conservative gain from Suffolk Together | Swing | ||||
Party | Candidate | Votes | % | ±% | |
---|---|---|---|---|---|
Liberal Democrats | John Field | 885 | 24.3 | +0.1 | |
Conservative | Kevin Welsby | 829 | 22.8 | +4.1 | |
Conservative | Aprille Meakin | 697 | 19.2 | +19.2 | |
Suffolk Together | Linda Scott | 668 | 18.4 | -11.9 | |
UKIP | Neil Harrison | 561 | 15.4 | +15.4 | |
Majority | |||||
Turnout | |||||
Liberal Democrats hold | Swing | ||||
Conservative gain from Suffolk Together | Swing | ||||
Party | Candidate | Votes | % | ±% | |
---|---|---|---|---|---|
Conservative | John Whitehead | 1,330 | 32.1 | +11.0 | |
Conservative | James Caston | 1,213 | 29.3 | +11.9 | |
Liberal Democrats | Mo Touman | 550 | 13.3 | +4.8 | |
Labour | Terry Wilson | 515 | 12.4 | +3.1 | |
Green | David Penny | 384 | 9.3 | +4.2 | |
Independent | Jennifer Wilson | 158 | 3.8 | +3.8 | |
Majority | |||||
Turnout | |||||
Conservative hold | Swing | ||||
Conservative gain from Liberal Democrats | Swing | ||||
Party | Candidate | Votes | % | ±% | |
---|---|---|---|---|---|
Conservative | Kathie Guthrie | 679 | 50.4 | -2.9 | |
Labour | Bec Jasper | 293 | 21.7 | +3.3 | |
UKIP | Roger Fouracre | 157 | 11.7 | +11.7 | |
Green | Mark Finbow | 151 | 11.2 | -7.4 | |
Liberal Democrats | David Payne | 68 | 5.0 | -4.6 | |
Majority | |||||
Turnout | |||||
Conservative hold | Swing | ||||
Party | Candidate | Votes | % | ±% | |
---|---|---|---|---|---|
Conservative | John Levantis | 1,619 | 34.4 | +1.9 | |
Green | Sarah Mansel | 1,003 | 21.3 | -0.3 | |
Liberal Democrats | Doug Reed | 908 | 19.3 | -0.9 | |
UKIP | Howard Jones | 750 | 16.0 | +16.0 | |
Green | Sylvie Warry | 421 | 9.0 | +9.0 | |
Majority | |||||
Turnout | |||||
Conservative hold | Swing | ||||
Green hold | Swing | ||||
Party | Candidate | Votes | % | ±% | |
---|---|---|---|---|---|
Independent | Charles Flatman | 639 | 54.6 | +5.2 | |
Green | Simon Hooton | 531 | 45.4 | +6.6 | |
Majority | |||||
Turnout | |||||
Independent hold | Swing | ||||
Party | Candidate | Votes | % | ±% | |
---|---|---|---|---|---|
Conservative | Lavnia Hadingham | 885 | 60.7 | +2.1 | |
Labour | Garry Deeks | 304 | 20.9 | +2.9 | |
Liberal Democrats | Andrew Aalders-Dunthorne | 269 | 18.5 | +18.5 | |
Majority | |||||
Turnout | |||||
Conservative hold | Swing | ||||
Party | Candidate | Votes | % | ±% | |
---|---|---|---|---|---|
Conservative | Diana Kearsley | 1,006 | 62.4 | +0.5 | |
Green | Rowland Warboys | 607 | 37.6 | +20.9 | |
Majority | |||||
Turnout | |||||
Conservative hold | Swing | ||||
Party | Candidate | Votes | % | ±% | |
---|---|---|---|---|---|
Green | Rachel Eburne | unopposed | |||
Majority | |||||
Turnout | |||||
Green hold | Swing | ||||
Party | Candidate | Votes | % | ±% | |
---|---|---|---|---|---|
Conservative | Tim Passmore | 956 | 70.8 | -2.6 | |
Liberal Democrats | Martin Spurling | 395 | 29.2 | +1.4 | |
Majority | |||||
Turnout | |||||
Conservative hold | Swing | ||||
Party | Candidate | Votes | % | ±% | |
---|---|---|---|---|---|
Conservative | Liz Gibson-Harries | 839 | 64.3 | +0.3 | |
Labour | Nicola Carr | 400 | 30.7 | +13.6 | |
Green | Tommy Gee | 65 | 5.0 | +5.0 | |
Majority | |||||
Turnout | |||||
Conservative hold | Swing | ||||
Party | Candidate | Votes | % | ±% | |
---|---|---|---|---|---|
Green | Andrew Stringer | 871 | 63.2 | -10.8 | |
Conservative | Paul Allen | 508 | 36.8 | +15.4 | |
Majority | |||||
Turnout | |||||
Green hold | Swing | ||||
Party | Candidate | Votes | % | ±% | |
---|---|---|---|---|---|
Liberal Democrats | Wendy Marchant | 1,307 | 32.5 | -9.8 | |
Liberal Democrats | Mike Norris | 921 | 22.9 | -11.5 | |
Conservative | Kay Oakes | 913 | 22.7 | +22.7 | |
UKIP | Samantha Streatfield | 470 | 11.7 | -0.4 | |
Green | Terence Carter | 409 | 10.2 | +10.2 | |
Majority | |||||
Turnout | |||||
Liberal Democrats hold | Swing | ||||
Party | Candidate | Votes | % | ±% | |
---|---|---|---|---|---|
Green | John Matthissen | 734 | 56.2 | -0.1 | |
UKIP | Andrew Billinge | 343 | 26.2 | N/A | |
Liberal Democrats | Julian Cunningham | 230 | 17.6 | +6.5 | |
Majority | |||||
Turnout | |||||
Green hold | Swing | ||||
Party | Candidate | Votes | % | ±% | |
---|---|---|---|---|---|
Conservative | David Burn | 870 | 65.1 | +6.4 | |
Green | Sarah Guthrie | 241 | 18.0 | -5.0 | |
Labour | Elaine Halton | 226 | 16.9 | -1.5 | |
Majority | |||||
Turnout | |||||
Conservative hold | Swing | ||||
Party | Candidate | Votes | % | ±% | |
---|---|---|---|---|---|
Liberal Democrats | Penny Otton | 728 | 58.6 | -5.7 | |
Conservative | Gilly Morgan | 515 | 41.4 | +5.7 | |
Majority | |||||
Turnout | |||||
Liberal Democrats hold | Swing | ||||
Party | Candidate | Votes | % | ±% | |
---|---|---|---|---|---|
Conservative | Darek Osbourne | 1,425 | 32.1 | -0.2 | |
Conservative | Jessica Fleming | 1,278 | 28.8 | -2.3 | |
Labour | Eddie Dougall | 596 | 13.4 | -2.5 | |
Green | Dominic Tooth | 421 | 9.5 | +9.5 | |
Green | Harriet Bowes | 408 | 9.2 | +9.2 | |
Liberal Democrats | Julia Truelove | 317 | 7.1 | +0.1 | |
Majority | |||||
Turnout | |||||
Conservative hold | Swing | ||||
Party | Candidate | Votes | % | ±% | |
---|---|---|---|---|---|
Conservative | David Whybrow | 740 | 48.7 | -0.3 | |
Liberal Democrats | Nick Willshere | 338 | 22.2 | -37.8 | |
UKIP | Mei Minns | 257 | 16.9 | +16.9 | |
Green | Patricia Aspinall | 186 | 12.2 | +12.2 | |
Majority | |||||
Turnout | |||||
Conservative gain from Liberal Democrats | Swing | ||||
Party | Candidate | Votes | % | ±% | |
---|---|---|---|---|---|
Conservative | Lesley Mayes | 966 | 24.7 | -2.5 | |
Conservative | Paul Ekpenyong | 865 | 22.1 | -1.2 | |
UKIP | Stephen Searle | 607 | 15.5 | +6.3 | |
Labour | Suzanne Britton | 505 | 12.9 | +1.7 | |
Green | Linda Baxter | 421 | 10.8 | -2.5 | |
Green | Miles Row | 322 | 8.2 | +8.2 | |
Liberal Democrats | John Curle | 232 | 5.9 | -0.5 | |
Majority | |||||
Turnout | |||||
Conservative hold | Swing | ||||
Party | Candidate | Votes | % | ±% | |
---|---|---|---|---|---|
Conservative | Gary Green | 2,292 | 21.7 | -0.5 | |
Conservative | Barry Humphreys | 1,948 | 18.4 | -0.7 | |
Conservative | David Muller | 1,705 | 16.1 | +1.1 | |
Labour | Duncan Macpherson | 1,284 | 12.1 | -3.7 | |
Green | Nigel Rozier | 1,145 | 10.8 | -2.8 | |
UKIP | Christopher Streatfield | 1,132 | 10.7 | +4.0 | |
Green | John Betts-Davies | 1,081 | 10.2 | +10.2 | |
Majority | |||||
Turnout | |||||
Conservative hold | Swing | ||||
Conservative gain from Labour | Swing | ||||
Party | Candidate | Votes | % | ±% | |
---|---|---|---|---|---|
Independent | Gerard Brewster | 934 | 26.8 | +8.2 | |
Conservative | Nick Gowrley | 856 | 24.6 | +6.4 | |
Liberal Democrats | Keith Scarff | 768 | 22.0 | +4.3 | |
UKIP | Stewart Minns | 574 | 16.5 | +14.2 | |
Green | Jen Overett | 352 | 10.1 | -3.1 | |
Majority | |||||
Turnout | |||||
Independent hold | Swing | ||||
Party | Candidate | Votes | % | ±% | |
---|---|---|---|---|---|
Green | Keith Welham | 686 | 54.1 | +39.6 | |
Conservative | Jemma Lynch | 583 | 45.9 | +5.3 | |
Majority | |||||
Turnout | |||||
Green gain from Conservative | Swing | ||||
Party | Candidate | Votes | % | ±% | |
---|---|---|---|---|---|
Conservative | Julie Flatman | 1,083 | 70.0 | +70.0 | |
Green | James Hargrave | 464 | 30.0 | +30.0 | |
Majority | |||||
Turnout | |||||
Conservative gain from Independent | Swing | ||||
Party | Candidate | Votes | % | ±% | |
---|---|---|---|---|---|
Conservative | Susan Morley | 834 | 58.6 | +12.4 | |
Green | Nicolas Hardingham | 425 | 29.9 | +14.7 | |
Liberal Democrats | Kay Field | 164 | 11.5 | -18.0 | |
Majority | |||||
Turnout | |||||
Conservative hold | Swing | ||||
Party | Candidate | Votes | % | ±% | |
---|---|---|---|---|---|
Conservative | Derrick Haley | 1,459 | 35.7 | -2.5 | |
Conservative | Esther Jewson | 918 | 22.5 | -5.2 | |
Liberal Democrats | Ellen Kirkby | 606 | 14.9 | -4.2 | |
Green | Jonathan Arnold | 576 | 14.1 | +14.1 | |
UKIP | Ryan Fiske | 523 | 12.8 | +4.2 | |
Majority | |||||
Turnout | |||||
Conservative hold | Swing | ||||
Party | Candidate | Votes | % | ±% | |
---|---|---|---|---|---|
Conservative | Glen Horn | 825 | 56.1 | +2.5 | |
Green | Peter Brooke | 647 | 44.0 | +15.8 | |
Majority | |||||
Turnout | |||||
Conservative hold | Swing | ||||
Party | Candidate | Votes | % | ±% | |
---|---|---|---|---|---|
Conservative | Jane Storey | 743 | 61.9 | +61.9 | |
Green | Claire Scotford | 458 | 38.1 | +13.2 | |
Majority | |||||
Turnout | |||||
Conservative gain from Independent | Swing | ||||
Party | Candidate | Votes | % | ±% | |
---|---|---|---|---|---|
Conservative | Matthew Hicks | unopposed | |||
Majority | |||||
Turnout | |||||
Conservative hold | Swing | ||||
Wards of the United Kingdom have been relatively settled in this area and have articles or summarised under others as below: [2]
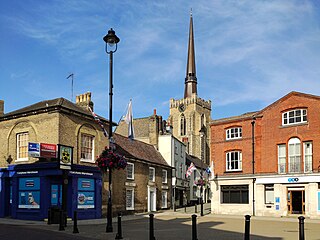
Mid Suffolk is a local government district in Suffolk, England. The district is primarily a rural area, containing just three towns, being Stowmarket, Needham Market and Eye. Its council was based in Needham Market until 2017 when it moved to shared offices with neighbouring Babergh District Council in Ipswich, outside either district. In 2021 it had a population of 103,417.
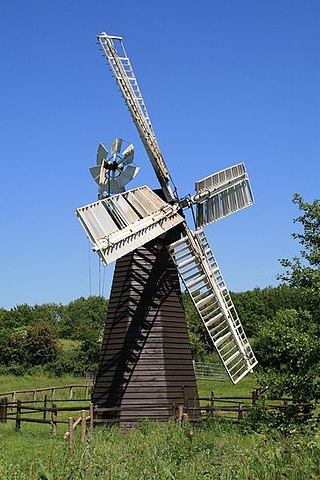
Stowmarket is a market town in Suffolk, England, on the busy A14 trunk road between Bury St Edmunds to the west and Ipswich to the southeast. The town lies on the Great Eastern Main Line (GEML) between Diss and Needham Market, and lies on the River Gipping, which is joined by its tributary, the River Rat, to the south of the town.
Central Suffolk and North Ipswich is a constituency represented in the House of Commons of the UK Parliament since 2010 by Dan Poulter, a Conservative.
Bury St Edmunds is a constituency represented in the House of Commons of the UK Parliament since 2015 by Jo Churchill, a Conservative.
Mid Suffolk District Council elections are held every four years to elect members of Mid Suffolk District Council in Suffolk, England. Since the last boundary changes in 2019, there have been 34 councillors elected from 26 wards.
Suffolk County Council in England is elected every four years. Since the last boundary changes in 2005, 75 councillors have been elected from 75 wards.
The 2007 Harlow District Council election took place on 3 May 2007 to elect members of Harlow District Council in Essex, England. One third of the council was up for election and the council stayed under no overall control.
Haughley is a village and civil parish in the English county of Suffolk, in the Mid Suffolk District. The village is located 2 miles (3.2 km) northwest of the town of Stowmarket, overlooking the Gipping valley, next to the A14 corridor. The population recorded in 2011 was 1,638. Mentioned in the Domesday Book, it was the site of a castle, a church on the pilgrim's route to Bury St Edmunds Abbey, and a market. Adjacent farms on the north side of the village were also home to one of the first studies of organic farming and the first headquarters of the Soil Association.
In the 2011 United Kingdom local elections, the Conservative Party held onto the Mid Suffolk District Council for a third term and even increased their majority. The Liberal Democrats lost four seats but remained in second place while the Green Party and the Labour Party each gained a seat, which is Labour's only seat on the Council.
The candidate information for the Haughley and Wetherden Ward in Mid-Suffolk, Suffolk, England.
The candidate information for the Stowmarket (Central) Ward in Mid-Suffolk, Suffolk, England. This ward elects two councillors.
The candidate information for the Stowmarket (North) Ward in Mid-Suffolk, Suffolk, England. This ward elects three councillors.
The candidate information for the Stowmarket (South) Ward in Mid-Suffolk, Suffolk, England. This ward elects two councillors.
An election to Essex County Council took place on 2 May 2013 as part of the 2013 United Kingdom local elections. 75 councillors were elected from 70 electoral divisions, which returned either one or two county councillors each by first-past-the-post voting for a four-year term of office. The electoral divisions were the same as those used at the previous election in 2009. No elections were held in Thurrock or Southend-on-Sea, which are unitary authorities outside the area covered by the County Council.
Elections to Suffolk County Council took place on 2 May 2013 as part of the 2013 United Kingdom local elections. 75 councillors were elected from 63 electoral divisions, which returned either one or two county councillors each by first-past-the-post voting for a four-year term of office. The electoral divisions were the same as those used at the previous election in 2009.
The 2019 United Kingdom local elections took place on Thursday 2 May 2019, with 248 English local councils, six directly elected mayors in England, and all 11 local councils in Northern Ireland being contested.
The 2023 United Kingdom local elections were held on Thursday, 4 May 2023 in England and on Thursday 18 May 2023 in Northern Ireland. These included district councils, unitary authorities, and directly elected mayors in England, and included all local councils in Northern Ireland. Notably, these elections were the first to be held under the Elections Act 2022, a new voter identification law that is controversial, meaning voters were required to show photo ID when attending a polling station.
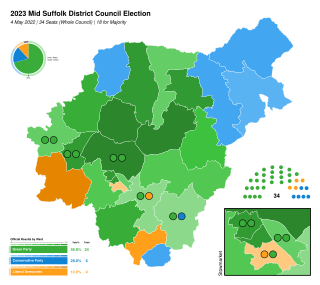
The 2023 Mid Suffolk District Council election took place on 4 May 2023 to elect members of Mid Suffolk District Council in Suffolk, England. This was on the same day as other local elections across England.
Waveney Valley is a proposed constituency of the House of Commons in the UK Parliament. Further to the completion of the 2023 Periodic Review of Westminster constituencies, it will first be contested at the next general election.