| |||||||||||||||||||||||||||||||||||||||||||||||||||||
All 59 seats to Central Bedfordshire Council 30 seats needed for a majority | |||||||||||||||||||||||||||||||||||||||||||||||||||||
---|---|---|---|---|---|---|---|---|---|---|---|---|---|---|---|---|---|---|---|---|---|---|---|---|---|---|---|---|---|---|---|---|---|---|---|---|---|---|---|---|---|---|---|---|---|---|---|---|---|---|---|---|---|
| |||||||||||||||||||||||||||||||||||||||||||||||||||||
Winner of each seat at the 2015 Central Bedfordshire Council election | |||||||||||||||||||||||||||||||||||||||||||||||||||||
|
Elections to Central Bedfordshire Council were held on 7 May 2015, along with the 2015 United Kingdom general election and other local elections. The whole council was up for election, with each successful candidate serving a four-year term of office, expiring in 2019.
The Conservative Party retained overall control of the council, winning 53 of the 59 seats on the council. Of the remaining 6 seats, 3 were won by Independents, 2 by the Labour Party and 1 by the Liberal Democrats.
Party | Seats | Gains | Losses | Net gain/loss | Seats % | Votes % | Votes | +/− | |
---|---|---|---|---|---|---|---|---|---|
Conservative | 53 | 5 | 1 | +4 | 89.83 | 53.78 | 138,953 | +0.17% | |
Independent | 3 | 1 | 2 | -1 | 5.08 | 10.38 | 26,814 | +2.33% | |
Labour | 2 | 2 | 1 | +1 | 3.39 | 16.84 | 43,512 | -5.39% | |
Liberal Democrats | 1 | 0 | 4 | -4 | 1.70 | 5.12 | 13,232 | -9.24% | |
UKIP | 0 | 0 | 0 | 0 | 0.0 | 8.22 | 21,253 | +7.50% | |
Green | 0 | 0 | 0 | 0 | 0.0 | 5.66 | 14,625 | +4.63% | |
The overall turnout was 66.37% with a total of 258,389 valid votes cast. A total of 1,085 ballots were rejected in the 25 wards in which the number of rejected votes was reported.
Following the 2011 election, the composition of the council was:
49 | 5 | 4 | 1 |
Conservative | LD | I | L |
After the election, the composition of the council was:
53 | 3 | 2 | 1 |
Conservative | I | L | LD |
I - Independent
L - Labour
LD - Liberal Democrats
Asterisks denote incumbent Councillors seeking re-election. Councillors seeking re-election were elected in 2011, and results are compared to that year's polls on that basis. All results are listed below:
Party | Candidate | Votes | % | ±% | |
---|---|---|---|---|---|
Conservative | Mike Blair* | 3,921 | 24.27 | +1.42 | |
Conservative | Paul Alan Duckett* | 3,753 | 23.23 | -2.19 | |
Conservative | Paul Raymond Downing | 2,899 | 19.95 | -2.22 | |
Independent | Mark Andrew Smith* | 2,378 | 14.72 | -8.18 | |
Green | Susan Heather Clinch | 1,739 | 10.76 | ||
Labour | Peter Joyce | 1,465 | 9.07 | +0.41 | |
Majority | 521 | 3.23 | |||
Turnout | 16,155 | 73.00 | +24.90 | ||
Conservative hold | Swing | ||||
Conservative gain from Independent | Swing | ||||
Conservative hold | Swing | ||||
A total of 123 ballots were rejected.
Party | Candidate | Votes | % | ±% | |
---|---|---|---|---|---|
Conservative | Ian Dalgarno* | 3,977 | 22.08 | +0.18 | |
Conservative | David Shelvey | 3,677 | 20.42 | -2.67 | |
Conservative | Richard David Wenham* | 3,321 | 18.44 | -2.49 | |
UKIP | Thomas Heeney | 1,939 | 10.77 | ||
Labour | David Charles Devereux | 1,914 | 10.63 | -1.28 | |
Labour | Douglas Alexander Landman | 1,649 | 9.15 | -1.94 | |
Independent | Robert David McGregor | 1,532 | 8.51 | ||
Majority | 1,382 | 7.67 | |||
Turnout | 18,009 | 69.00 | +28.00 | ||
Conservative hold | Swing | ||||
A total of 84 ballots were rejected.
Party | Candidate | Votes | % | ±% | |
---|---|---|---|---|---|
Conservative | Budge Wells | 2,012 | 73.24 | -2.08 | |
Green | Robin Alexander Harewood-Lee | 735 | 26.76 | ||
Majority | 1,277 | 46.48 | |||
Turnout | 2,747 | 74.00 | +27.40 | ||
Conservative hold | Swing | ||||
A total of 33 ballots were rejected.
Party | Candidate | Votes | % | ±% | |
---|---|---|---|---|---|
Independent | Ian Leslie Shingler* | 1,518 | 51.13 | +19.22 | |
Conservative | Gareth Mackey | 759 | 25.56 | +4.49 | |
Liberal Democrats | Janet Ann Nunn | 417 | 14.05 | -9.61 | |
Labour | Lesley Ann Lodge | 275 | 9.26 | +2.15 | |
Majority | 759 | 25.57 | |||
Turnout | 2,969 | 74.00 | +25.20 | ||
Independent hold | Swing | ||||
A total of 13 ballots were rejected.
Party | Candidate | Votes | % | ±% | |
---|---|---|---|---|---|
Conservative | Maurice Richard Jones* | 1,594 | 25.27 | -1.57 | |
Conservative | Jane Gay Wimberley Lawrence* | 1,472 | 23.33 | -3.75 | |
Labour | Pete Biernis | 977 | 15.49 | -6.60 | |
UKIP | Frank Foster | 925 | 14.66 | ||
Labour | Bernard Victor Briars | 910 | 14.43 | -9.56 | |
Green | Amy-Jane Peabody | 430 | 6.82 | ||
Majority | 495 | 7.84 | |||
Turnout | 6,308 | 63.00 | +24.80 | ||
Conservative hold | Swing | ||||
A total of 36 ballots were rejected.
Party | Candidate | Votes | % | ±% | |
---|---|---|---|---|---|
Conservative | David John Lawrence* | 2,575 | 28.27 | -2.19 | |
Conservative | Tim Woodward | 1,982 | 21.76 | -7.85 | |
Conservative | David William Frank Albone | 1,246 | 13.68 | ||
UKIP | Duncan Anthony Strachan | 1,209 | 13.27 | ||
Independent | Bernard John Rix | 779 | 8.55 | ||
Labour | Satinderjit Singh Dhaliwal | 672 | 7.38 | -13.32 | |
Green | Andrew Richard Peabody | 646 | 7.09 | ||
Majority | 736 | 8.08 | |||
Turnout | 9,109 | 67.00 | +25.30 | ||
Conservative hold | Swing | ||||
A total of 25 ballots were rejected.
Party | Candidate | Votes | % | ±% | |
---|---|---|---|---|---|
Conservative | Kevin Mark Collins | 2,888 | 29.48 | -6.83 | |
Conservative | Richard Charles Stay* | 2,740 | 27.97 | -7.01 | |
Labour | Ian Guy Lowery | 733 | 7.48 | -4.17 | |
Labour | Shirley Jean Smith | 666 | 6.80 | -0.15 | |
Independent | Patrick Brian Smith | 615 | 6.28 | ||
Independent | Chrystna Yvonne Smith | 495 | 5.05 | ||
Green | Matt Ogier-Russell | 478 | 4.88 | ||
Majority | 1,559 | 15.91 | |||
Turnout | 9,796 | 72.00 | +24.80 | ||
Conservative hold | Swing | ||||
A total of 46 ballots were rejected.
Party | Candidate | Votes | % | ±% | |
---|---|---|---|---|---|
Conservative | Sue Clark* | 3,381 | 22.00 | +4.12 | |
Conservative | Ken Matthews* | 2,977 | 19.37 | +2.56 | |
Conservative | Robert William Morris | 2,765 | 17.99 | +0.73 | |
UKIP | Roger Baker | 1,958 | 12.74 | ||
Labour | Elizabeth Margaret Rooney | 1,208 | 7.86 | +0.15 | |
Labour | Alan Joseph Morris | 1,156 | 7.52 | -0.12 | |
Labour | Andrew Shaw | 1,093 | 7.11 | -0.21 | |
Green | Alison Heather Parker | 831 | 5.41 | ||
Majority | 807 | 5.25 | |||
Turnout | 15,369 | 67.00 | +27.80 | ||
Conservative hold | Swing | ||||
A total of 24 ballots were rejected.
Party | Candidate | Votes | % | ±% | |
---|---|---|---|---|---|
Conservative | Carole Hegley* | 1,162 | 52.70 | -11.94 | |
Labour | Theresa Moira Miller | 674 | 30.57 | +7.53 | |
Independent | Ian Phillip Bunker | 369 | 16.73 | ||
Majority | 488 | 22.13 | |||
Turnout | 2,205 | 63.00 | +24.00 | ||
Conservative hold | Swing | ||||
The number of ballots rejected was not reported by the council.
Party | Candidate | Votes | % | ±% | |
---|---|---|---|---|---|
Conservative | David John McVicar* | 2,062 | 31.61 | +7.84 | |
Conservative | John Anthony Chatterley | 1,975 | 30.28 | +9.64 | |
Labour | Catherine Theresa Howes | 980 | 15.02 | -0.41 | |
Labour | Michael Aneurin Stokes | 874 | 13.40 | -1.45 | |
Independent | Christine Ann Reynolds | 632 | 9.69 | ||
Majority | 995 | 15.26 | |||
Turnout | 6,523 | 63.00 | +28.60 | ||
Conservative hold | Swing | ||||
The number of ballots rejected was not reported by the council.
Party | Candidate | Votes | % | ±% | |
---|---|---|---|---|---|
Conservative | Eugene Patrick Ghent | 879 | 39.05 | -3.42 | |
Independent | Neal Reynolds | 697 | 30.96 | ||
Labour | Roger Barry Pepworth | 675 | 29.99 | -12.99 | |
Majority | 182 | 8.09 | |||
Turnout | 2,251 | 59.00 | +21.80 | ||
Conservative gain from Labour | Swing | ||||
A total of 41 ballots were rejected.
Party | Candidate | Votes | % | ±% | |
---|---|---|---|---|---|
Conservative | Jeannette Freeman | 1,806 | 23.21 | +4.96 | |
Conservative | Nigel Austin Warren | 1,436 | 18.45 | +0.11 | |
Independent | Julian David Murray* | 1,063 | 13.66 | -7.59 | |
Labour | Michael Andrew Rogers | 1,027 | 13.20 | -1.78 | |
Independent | Bev Coleman | 933 | 11.99 | ||
Labour | Robert Leslie Shelley | 773 | 9.93 | -4.46 | |
Green | Peter John Burrows | 409 | 5.26 | ||
Green | Catherine Joyce Aganoglu | 335 | 4.30 | ||
Majority | 373 | 4.79 | |||
Turnout | 7,782 | 59.00 | +22.40 | ||
Conservative gain from Independent | Swing | ||||
Conservative hold | Swing | ||||
The number of ballots rejected was not reported by the council.
Party | Candidate | Votes | % | ±% | |
---|---|---|---|---|---|
Conservative | Peter Nugent Hollick* | 3,135 | 32.88 | -1.47 | |
Conservative | Nigel Young | 3,097 | 32.48 | -1.01 | |
Labour | Michael Rolfe Ingham | 994 | 10.42 | -1.55 | |
Labour | Sheila Morgan | 966 | 10.13 | -1.68 | |
Independent | Beryl Mary Meakins | 750 | 7.86 | ||
Independent | Alan Gerard Corkhill | 594 | 6.23 | ||
Majority | 38 | 0.40 | |||
Turnout | 9,536 | 69.00 | +27.20 | ||
Conservative hold | Swing | ||||
The number of ballots rejected was not reported by the council.
Party | Candidate | Votes | % | ±% | |
---|---|---|---|---|---|
Conservative | Ken Janes | 1,225 | 50.83 | -24.17 | |
Independent | Ruth Archer | 943 | 39.13 | ||
Labour | Isaac Chikwakwanyi Sibiya | 242 | 10.04 | -9.16 | |
Majority | 282 | 11.70 | |||
Turnout | 2,410 | 72.00 | +26.00 | ||
Conservative hold | Swing | ||||
A total of 21 ballots were rejected.
Party | Candidate | Votes | % | ±% | |
---|---|---|---|---|---|
Conservative | Fiona Chapman | 3,511 | 20.80 | +6.12 | |
Conservative | Andrew Michael Turner* | 3,274 | 19.40 | +1.94 | |
Conservative | Charles Christopher Gomm* | 2,762 | 16.36 | +1.86 | |
Labour | David William Austine Short | 1,585 | 9.39 | +1.90 | |
UKIP | Adam Glen Larkins | 1,522 | 9.02 | ||
Labour | Sheila Gardner | 1,514 | 8.97 | +2.18 | |
UKIP | Russell Edward Shaw | 1,368 | 8.10 | ||
Green | David Christian Parrock | 1,344 | 7.96 | +3.16 | |
Majority | 1,177 | 6.97 | |||
Turnout | 16,880 | 70.00 | 34.40 | ||
Conservative hold | Swing | ||||
A total of 57 ballots were rejected.
Party | Candidate | Votes | % | ±% | |
---|---|---|---|---|---|
Conservative | Mark Anthony Gaius Versallion* | ||||
Conservative hold | Swing | ||||
Mark Versallion was re-elected unopposed.
Party | Candidate | Votes | % | ±% | |
---|---|---|---|---|---|
Conservative | Angela Barker* | 1,137 | 67.56 | ||
Labour | Paul Michael Forster | 299 | 17.76 | ||
Independent | Richard James | 247 | 14.68 | ||
Majority | 838 | 49.80 | |||
Turnout | 1,683 | 77.00 | N/A | ||
Conservative hold | Swing | ||||
A total of 22 ballots were rejected.
Party | Candidate | Votes | % | ±% | |
---|---|---|---|---|---|
Conservative | John Robert Kane | 1,336 | 24.44 | +7.69 | |
Liberal Democrats | Susan Anne Goodchild* | 1,250 | 22.87 | -2.25 | |
Liberal Democrats | Laura Jane Mary Ellaway | 874 | 15.99 | -4.52 | |
Labour | Chris Slough | 806 | 14.74 | +2.15 | |
Labour | Syed Qaiser Abbas | 700 | 12.81 | +0.84 | |
Green | Steve Finan | 500 | 9.15 | ||
Majority | 376 | 6.88 | |||
Turnout | 5,466 | 56.00 | +23.90 | ||
Conservative gain from Liberal Democrats | Swing | ||||
Liberal Democrats hold | Swing | ||||
A total of 65 ballots were rejected.
Party | Candidate | Votes | % | ±% | |
---|---|---|---|---|---|
Conservative | Ken Ferguson | 3,663 | 19.56 | +2.08 | |
Conservative | Brian John Spurr* | 3,640 | 19.44 | +0.88 | |
Conservative | Roy William Johnstone* | 3,509 | 18.74 | -0.56 | |
Labour | Michael John Bishop | 1,614 | 8.62 | -0.92 | |
Labour | Daniel Scott | 1,438 | 7.68 | -0.52 | |
Labour | Ian Michael Purvis | 1,331 | 7.11 | -2.42 | |
Green | Jonathan Adrian Hull | 737 | 3.94 | ||
Liberal Democrats | Rosalind Mennie | 734 | 3.92 | -1.24 | |
Green | Simon James Wilson | 713 | 3.81 | ||
Liberal Democrats | Alan Roger White | 674 | 3.60 | -2.80 | |
Green | Gary Woodwards | 671 | 3.58 | ||
Majority | 1,895 | 10.12 | |||
Turnout | 18,724 | 63.00 | +26.10 | ||
Conservative hold | Swing | ||||
A total of 102 ballots were rejected.
Party | Candidate | Votes | % | ±% | |
---|---|---|---|---|---|
Conservative | Amanda Louise Dodwell* | 2,999 | 18.29 | -1.20 | |
Conservative | Dave Bowater* | 2,862 | 17.46 | -2.07 | |
Conservative | Ray Berry* | 2,823 | 17.22 | -2.47 | |
Labour | John Stephen Bone | 1,302 | 7.94 | -3.26 | |
UKIP | Garry Lelliott | 1,163 | 7.09 | ||
Labour | Adrian Peter Heffernan | 1,046 | 6.38 | ||
Labour | Christopher Phillip Earnshaw Northedge | 929 | 5.67 | -3.92 | |
Liberal Democrats | Anne Elizabeth Gray | 559 | 3.41 | -3.66 | |
Green | Nichola Lynne Cheesewright | 543 | 3.31 | ||
Liberal Democrats | Anne Jennifer Guess | 481 | 2.93 | -3.89 | |
Green | Emily Anne Lawrence | 474 | 2.89 | ||
Liberal Democrats | Celia Mary Snelling | 452 | 2.76 | -3.91 | |
Independent | Paul Leslie Adams | 401 | 2.45 | ||
Green | Kenton Roger Charles Sumner | 361 | 2.20 | ||
Majority | 137 | 0.83 | |||
Turnout | 16,395 | 64.00 | +28.00 | ||
Conservative hold | Swing | ||||
A total of 73 ballots were rejected.
Party | Candidate | Votes | % | ±% | |
---|---|---|---|---|---|
Conservative | Gordon Perham | 2,935 | 16.14 | -1.16 | |
Conservative | Gary David Tubb | 2,814 | 15.48 | +2.56 | |
Conservative | Benjamin Mark Ian Walker | 2,418 | 13.30 | +1.18 | |
Liberal Democrats | Peter John Snelling | 1,333 | 7.33 | -4.65 | |
Labour | Peter William Palfrey | 1,068 | 5.87 | -1.00 | |
Liberal Democrats | Russ Goodchild | 1,027 | 5.65 | -4.02 | |
Labour | Rebekah Price | 972 | 5.35 | -0.48 | |
Liberal Democrats | Nigel Kenneth Carnell | 958 | 5.27 | -6.31 | |
UKIP | Ian Thomas Reynolds | 930 | 5.11 | ||
Labour | Gerald Alfred Sandison | 914 | 5.03 | -0.37 | |
Green | Ken Barry | 834 | 4.59 | -1.24 | |
UKIP | Mike Woodhouse | 770 | 4.24 | ||
Green | Parisa Francesca Rosina Darling | 667 | 3.67 | ||
Green | Tony Mabbott | 541 | 2.97 | ||
Majority | 121 | 0.66 | |||
Turnout | 18,181 | 71.00 | +25.00 | ||
Conservative hold | Swing | ||||
A total of 71 ballots were rejected.
Party | Candidate | Votes | % | ±% | |
---|---|---|---|---|---|
Conservative | Frank Wray Firth | 932 | 61.39 | -6.92 | |
UKIP | Paul Goodchild | 331 | 21.81 | ||
Labour | Peter Heyes | 255 | 16.80 | +0.23 | |
Majority | 601 | 39.58 | |||
Turnout | 1,518 | 43.00 | -7.90 | ||
Conservative hold | Swing | ||||
A total of 14 ballots were rejected.
Party | Candidate | Votes | % | ±% | |
---|---|---|---|---|---|
Labour | Antonia Petra Ryan | 510 | 26.87 | +5.92 | |
Independent | Alan David Winter | 486 | 25.61 | ||
UKIP | Stephen John North | 387 | 20.39 | ||
Conservative | Adam Fahn | 384 | 20.23 | ||
Independent | Jimmy Carroll | 131 | 6.90 | ||
Majority | 24 | 1.26 | |||
Turnout | 1,898 | 53.00 | +22.90 | ||
Labour gain from Liberal Democrats | Swing | ||||
A total of 13 ballots were rejected.
Party | Candidate | Votes | % | ±% | |
---|---|---|---|---|---|
Independent | Adam Zerny* | 3,059 | 47.35 | +10.93 | |
Conservative | Doreen Beatrice Gurney* | 1,384 | 21.42 | -2.62 | |
Conservative | Allan Mathieson Drew | 1,223 | 18.93 | -3.35 | |
Labour | Adam John Dutton | 795 | 12.30 | +3.07 | |
Majority | 161 | 2.49 | |||
Turnout | 6,461 | 73.00 | +22.60 | ||
Independent hold | Swing | ||||
Conservative hold | Swing | ||||
A total of 33 ballots were rejected.
Party | Candidate | Votes | % | ±% | |
---|---|---|---|---|---|
Conservative | Caroline Mauldin* | 2,798 | 16.43 | -0.41 | |
Conservative | Tracey Deborah Stock | 2,332 | 13.69 | -2.62 | |
Conservative | Peter Lindsay Smith | 2,294 | 13.47 | +1.40 | |
Liberal Democrats | Nigel Aldis | 1,378 | 8.09 | -4.73 | |
UKIP | Christopher Butterfield | 1,286 | 7.55 | ||
UKIP | George Konstantinidis | 1,087 | 6.38 | +0.17 | |
UKIP | Peter Edwin Day | 1,081 | 6.35 | ||
Labour | Cheryl Ann McDonald | 1,055 | 6.20 | -0.20 | |
Independent | Ken Lynch | 1,018 | 5.98 | ||
Labour | Tom Noakes | 849 | 4.99 | -1.48 | |
Liberal Democrats | Jafor Ali | 723 | 4.25 | -4.50 | |
Independent | Stephen Robert Laurie Allen | 572 | 3.36 | -3.10 | |
Liberal Democrats | Gee Leach | 555 | 3.26 | -4.41 | |
Majority | 916 | 5.38 | |||
Turnout | 17,028 | 64.00 | +26.50 | ||
Conservative hold | Swing | ||||
Conservative gain from Liberal Democrats | Swing | ||||
A total of 37 ballots were rejected.
Party | Candidate | Votes | % | ±% | |
---|---|---|---|---|---|
Conservative | Lewis Birt* | 2,734 | 32.14 | +1.57 | |
Conservative | Tony Brown* | 2,630 | 30.92 | +1.55 | |
Labour | Nigel Ian Rushby | 1,176 | 13.83 | +2.29 | |
UKIP | Jonathan Shilton | 1,030 | 12.11 | +3.39 | |
UKIP | Roger Martin Smith | 936 | 11.00 | ||
Majority | 1,454 | 17.09 | |||
Turnout | 8,506 | 69.00 | +27.50 | ||
Conservative hold | Swing | ||||
A total of 31 ballots were rejected.
Party | Candidate | Votes | % | ±% | |
---|---|---|---|---|---|
Independent | Alison Mary Wainman Graham | 1,394 | 45.98 | ||
Conservative | Ian Jeremy Knighton | 1,276 | 42.08 | -4.14 | |
Labour | Keith Richard Whitwell | 362 | 11.94 | +5.57 | |
Majority | 118 | 3.90 | |||
Turnout | 3,032 | 75.00 | +23.50 | ||
Independent gain from Conservative | Swing | ||||
A total of 23 ballots were rejected.
Party | Candidate | Votes | % | ±% | |
---|---|---|---|---|---|
Conservative | Brian Saunders | 3,750 | 21.25 | +3.11 | |
Conservative | John Alfred George Saunders* | 3,261 | 18.48 | +0.87 | |
Conservative | Steven Ian Graham Dixon | 3,205 | 18.16 | +1.35 | |
UKIP | Roy Mitchell | 1,667 | 9.44 | ||
Labour | Lucy Kelly | 1,570 | 8.90 | +2.71 | |
Independent | Alan Reginald Cooper | 1,539 | 8.72 | ||
Independent | Larry Stoter | 1,484 | 8.41 | ||
Green | Craig Thomas | 1,172 | 6.64 | ||
Majority | 1,538 | 8.72 | |||
Turnout | 17,648 | 69.00 | +22.90 | ||
Conservative hold | Swing | ||||
A total of 38 ballots were rejected.
Party | Candidate | Votes | % | ±% | |
---|---|---|---|---|---|
Labour | Tony Swain | 522 | 30.58 | -14.80 | |
Conservative | Tony Morris | 485 | 28.41 | ||
Independent | David Abbott | 288 | 16.87 | ||
Liberal Democrats | Marion Frances Rolfe | 230 | 13.48 | -41.14 | |
Independent | Tracey Karen McMahon | 182 | 10.66 | ||
Majority | 37 | 2.17 | |||
Turnout | 1,707 | 55.00 | +22.90 | ||
Labour gain from Liberal Democrats | Swing | ||||
A total of 34 ballots were rejected.
Party | Candidate | Votes | % | ±% | |
---|---|---|---|---|---|
Conservative | Norman Bryan Costin* | 2,391 | 25.82 | +0.54 | |
Conservative | Thomas Nicols* | 1,616 | 17.45 | -9.58 | |
UKIP | Richard Roe | 1,154 | 12.46 | ||
Liberal Democrats | Brian James Golby | 982 | 10.61 | -5.38 | |
Labour | Rachel Joy Elizabeth Garnham | 977 | 10.55 | -0.31 | |
Independent | Mary Elizabeth Walsh | 822 | 8.88 | ||
Independent | Michael Stonnell | 712 | 7.69 | ||
Liberal Democrats | Linda Anne Jack | 605 | 6.54 | -4.43 | |
Majority | 462 | 4.99 | |||
Turnout | 9,259 | 71.00 | +26.70 | ||
Conservative hold | Swing | ||||
A total of 25 ballots were rejected.
Party | Candidate | Votes | % | ±% | |
---|---|---|---|---|---|
Conservative | James Gerard Jamieson* | 1,859 | 65.60 | 5.76 | |
UKIP | Steven David Wildman | 510 | 17.99 | ||
Green | James Malcolm Chalmers | 465 | 16.41 | -3.56 | |
Majority | 1,349 | 47.61 | |||
Turnout | 2,834 | 74.00 | +25.90 | ||
Conservative hold | Swing | ||||
The number of ballots rejected was not reported by the council.
Bedfordshire is a ceremonial county in the East of England. It is bordered by Northamptonshire to the north, Cambridgeshire to the north-east, Hertfordshire to the south and the south-east, and Buckinghamshire to the west. The largest settlement is Luton (225,262), and Bedford is the county town.
South West Bedfordshire is a constituency represented in the House of Commons of the UK Parliament. As with all constituencies of the UK Parliament, it elects one Member of Parliament (MP) by the first past the post system of election.
Mid Bedfordshire is a constituency represented in the House of Commons of the UK Parliament by Alistair Strathern of the Labour Party since a 2023 by-election.
Dunstable is a market town and civil parish in Bedfordshire, England, east of the Chiltern Hills, 30 miles north of London. There are several steep chalk escarpments, most noticeable when approaching Dunstable from the north. Dunstable is the fourth largest town in Bedfordshire and along with Houghton Regis forms the westernmost part of the Luton/Dunstable urban area.
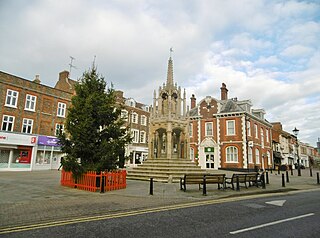
Central Bedfordshire is a unitary authority area in the ceremonial county of Bedfordshire, England. It was created in 2009.
Elections to Central Bedfordshire Council were held on 4 June 2009. This was the first elections to the newly formed council, with all 66 seats being up for election, elected in wards that matched the previous County Council electoral divisions, but with twice as many councillors being elected in each. All Councillors elected would serve a two-year term, expiring in 2011, when ward boundaries would be reviewed. The Conservative Party won overall control of the council, managing to win 54 of 66 seats on the council.
The 2011 Central Bedfordshire Council electionfor the Central Bedfordshire Council were held on 5 May 2011, along with other United Kingdom local elections. The whole council was up for election following boundary changes, with each successful candidate serving a four-year term of office, expiring in 2015.
Elections to Mid Bedfordshire District Council were held in May 2007. These were the last elections to council, with all 53 seats being up for election. Councillors elected would serve a two-year term, expiring in 2009, when Mid Bedfordshire District Council was replaced by Central Bedfordshire Council. The Conservative Party retained overall control of the council, winning 37 of 53 seats on the council. The Conservatives won 8 seats unopposed, as did an Independent candidate in one ward.
Elections to Mid Bedfordshire District Council were held on 1 May 2003. All 53 seats were up for election. Councillors elected would serve a four-year term, expiring in 2007. The Conservative Party retained overall control of the council, winning 37 of 53 seats on the council. The Conservatives won 7 seats unopposed.
Elections to Mid Bedfordshire District Council were held on 6 May 1999. All 53 seats were up for election. The Conservative Party gained overall control of the council, increasing their number of seats from 22 to 34, whilst the Labour Party declined from having 20 seats in 1995 to 7.
Elections to Mid Bedfordshire District Council were held on 4 May 1995. All 53 seats were up for election.
Elections to Mid Bedfordshire District Council were held on 2 May 1991. All 53 seats were up for election.
Elections to Mid Bedfordshire District Council were held on 7 May 1987. All 53 seats were up for election.
Elections to Mid Bedfordshire District Council were held on 5 May 1983. All 53 seats were up for election.
Elections to Mid Bedfordshire District Council were held on 3 May 1979, on the same day as the general election, so turnout was higher than usual in district council elections for Mid Bedfordshire. All 53 seats were up for election.
Elections to Mid Bedfordshire District Council in Mid Bedfordshire, England, were held in May 1976. All 53 seats were up for election.
Dunstable and Leighton Buzzard is a proposed constituency of the House of Commons in the UK Parliament. Further to the completion of the 2023 Periodic Review of Westminster constituencies, enacted by the Parliamentary Constituencies Order 2023, it will first be contested at the next general election.
The 2023 Central Bedfordshire Council election took place on 4 May 2023 to elect members of Central Bedfordshire Council in Bedfordshire, England. This was on the same day as other local elections. New ward boundaries increased the number of seats on the council by four.