The 1983 North Bedfordshire Borough Council election took place on 5 May 1983 to elect members of North Bedfordshire Borough Council in England. [1] This was on the same day as other local elections.
Party | Seats | Gains | Losses | Net gain/loss | Seats % | Votes % | Votes | +/− | |
---|---|---|---|---|---|---|---|---|---|
Conservative | 32 | 4 | 60.4 | 42.9 | 44,195 | +1.7 | |||
Labour | 9 | 1 | 17.0 | 29.7 | 30,606 | +0.8 | |||
Alliance | 9 | 2 | 17.0 | 24.4 | 25,122 | –3.9 | |||
Independent | 3 | 5.7 | 2.9 | 2,952 | +1.3 | ||||
Communist | 0 | 0.0 | 0.1 | 56 | N/A |
Party | Candidate | Votes | % | ±% | |
---|---|---|---|---|---|
Conservative | E. Constable | 1,321 | 53.5 | ||
Conservative | R. Gwynne Jones | 1,218 | 49.3 | ||
Conservative | A. Semark | 1,172 | 47.5 | ||
Alliance | F. Groves | 791 | 32.0 | ||
Alliance | T. Hill | 713 | 28.9 | ||
Alliance | N. Hill | 712 | 28.8 | ||
Labour | M. Hubbard | 357 | 14.5 | ||
Labour | C. Bainbridge | 332 | 13.4 | ||
Labour | M. Sargeant | 324 | 13.1 | ||
Turnout | 2,469 | 41.7 | |||
Conservative win (new seat) | |||||
Conservative win (new seat) |
Party | Candidate | Votes | % | ±% | |
---|---|---|---|---|---|
Conservative | V. Cartwright | 1,321 | 66.4 | ||
Conservative | G. Bates | 1,172 | 58.9 | ||
Alliance | A. Barnes | 791 | 39.8 | ||
Alliance | E. Macrae | 713 | 35.8 | ||
Labour | G. Blowers | 332 | 16.7 | ||
Labour | T. Albone | 324 | 16.3 | ||
Turnout | 1,989 | 51.9 | |||
Conservative win (new seat) | |||||
Conservative win (new seat) |
Party | Candidate | Votes | % | ±% | |
---|---|---|---|---|---|
Independent | V. Brandon | 701 | 61.2 | ||
Conservative | J. Fletcher | 444 | 38.8 | ||
Turnout | 1,145 | 67.0 | |||
Independent win (new seat) |
Party | Candidate | Votes | % | ±% | |
---|---|---|---|---|---|
Conservative | M. Dewar | 1,095 | 44.9 | ||
Conservative | R. Rigby | 1,053 | 43.2 | ||
Conservative | M. Simic | 1,038 | 42.5 | ||
Labour | D. Marshall | 724 | 29.7 | ||
Labour | M. Brophy | 719 | 29.5 | ||
Labour | T. Samain | 691 | 28.3 | ||
Alliance | D. Scott | 620 | 25.4 | ||
Alliance | C. Green | 572 | 23.4 | ||
Alliance | Dave Hodgson | 524 | 21.5 | ||
Turnout | 2,440 | 54.9 | |||
Conservative win (new seat) | |||||
Conservative win (new seat) |
Party | Candidate | Votes | % | ±% | |
---|---|---|---|---|---|
Labour | W. Astle | 1,654 | 62.4 | ||
Labour | V. Storrow | 1,618 | 61.0 | ||
Labour | R. Elford | 1,587 | 59.8 | ||
Conservative | J. Simmonds | 546 | 20.6 | ||
Alliance | A. Christie | 395 | 14.9 | ||
Alliance | C. Green | 343 | 12.9 | ||
Alliance | M. Sears | 318 | 12.0 | ||
Communist | P. Waite | 56 | 2.1 | ||
Turnout | 2,652 | 47.6 | |||
Labour win (new seat) | |||||
Labour win (new seat) |
Party | Candidate | Votes | % | ±% | |
---|---|---|---|---|---|
Alliance | M. Nice | 783 | 45.4 | ||
Alliance | D. Osborne | 596 | 34.6 | ||
Conservative | W. Martin | 476 | 27.6 | ||
Labour | D. Two | 465 | 27.0 | ||
Conservative | P. Grange | 458 | 26.6 | ||
Labour | M. Fletcher | 290 | 16.8 | ||
Turnout | 1,725 | 57.3 | |||
Alliance win (new seat) | |||||
Alliance win (new seat) |
Party | Candidate | Votes | % | ±% | |
---|---|---|---|---|---|
Conservative | F. Barley | 1,413 | 55.7 | ||
Conservative | D. Lennox-Lamb | 1,411 | 55.6 | ||
Conservative | A. Watkins | 1,404 | 55.3 | ||
Alliance | J. Struthers | 706 | 27.8 | ||
Alliance | S. Wilson | 673 | 26.5 | ||
Alliance | W. Wright | 640 | 25.2 | ||
Labour | E. Grugeon | 420 | 16.5 | ||
Labour | H. Mitchell | 419 | 16.5 | ||
Labour | Y. Anderson | 408 | 16.1 | ||
Turnout | 2,539 | 46.1 | |||
Conservative win (new seat) | |||||
Conservative win (new seat) |
Party | Candidate | Votes | % | ±% | |
---|---|---|---|---|---|
Alliance | J. Chapman | 556 | 49.1 | ||
Conservative | D. Hoyle | 477 | 42.1 | ||
Labour | S. Lowe | 99 | 8.7 | ||
Turnout | 1,132 | 56.7 | |||
Alliance win (new seat) |
Party | Candidate | Votes | % | ±% | |
---|---|---|---|---|---|
Conservative | F. Gibbs | 583 | 64.2 | ||
Alliance | G. Shipp | 115 | 12.7 | ||
Independent | G. Airton | 114 | 12.6 | ||
Labour | J. Yoell | 96 | 10.6 | ||
Turnout | 908 | 52.4 | |||
Conservative win (new seat) |
Party | Candidate | Votes | % | ±% | |
---|---|---|---|---|---|
Alliance | I. Hedley | 1,171 | 47.4 | ||
Alliance | S. Marsh | 1,141 | 46.2 | ||
Alliance | S. Hickman | 1,122 | 45.4 | ||
Labour | C. Loxley | 773 | 31.3 | ||
Labour | M. Haley | 761 | 30.8 | ||
Labour | J. Loxley | 754 | 30.5 | ||
Conservative | V. Fulford | 523 | 21.2 | ||
Conservative | D. Davis | 518 | 21.0 | ||
Conservative | S. King | 496 | 20.1 | ||
Turnout | 2,469 | 45.0 | |||
Alliance win (new seat) | |||||
Alliance win (new seat) |
Party | Candidate | Votes | % | ±% | |
---|---|---|---|---|---|
Conservative | D. Fordham | 637 | 61.0 | ||
Alliance | J. Abbott | 341 | 32.6 | ||
Labour | M. Holden | 67 | 6.4 | ||
Turnout | 1,045 | 57.5 | |||
Conservative win (new seat) |
Party | Candidate | Votes | % | ±% | |
---|---|---|---|---|---|
Conservative | B. Dillingham | 1,279 | 60.0 | ||
Conservative | M. O'Driscoll | 1,089 | 51.1 | ||
Conservative | J. Temperley | 1,012 | 47.5 | ||
Labour | D. Heywood | 607 | 28.5 | ||
Labour | J. Shields | 596 | 28.0 | ||
Labour | B. Anderson | 589 | 27.7 | ||
Alliance | M. Waters | 242 | 11.4 | ||
Alliance | E. Evans | 227 | 10.7 | ||
Alliance | S. Blunt | 225 | 10.6 | ||
Turnout | 2,130 | 42.6 | |||
Conservative win (new seat) | |||||
Conservative win (new seat) |
Party | Candidate | Votes | % | ±% | |
---|---|---|---|---|---|
Conservative | D. Smith | 642 | 53.8 | ||
Alliance | R. Woodside | 354 | 29.7 | ||
Labour | M. Edwards | 197 | 16.5 | ||
Turnout | 1,193 | 56.5 | |||
Conservative win (new seat) |
Party | Candidate | Votes | % | ±% | |
---|---|---|---|---|---|
Conservative | P. Hooley | 1,325 | 47.9 | ||
Conservative | C. Attenborough | 1,284 | 46.4 | ||
Conservative | G. Gilbert | 1,240 | 44.8 | ||
Labour | S. Devereaux | 1,101 | 39.8 | ||
Labour | N. Crowley | 964 | 34.9 | ||
Labour | W. Wilson | 947 | 34.2 | ||
Alliance | J. Brockett | 341 | 12.3 | ||
Alliance | N. Hickman | 270 | 9.8 | ||
Alliance | D. Johnson | 225 | 8.1 | ||
Turnout | 2,766 | 44.8 | |||
Conservative win (new seat) | |||||
Conservative win (new seat) |
Party | Candidate | Votes | % | ±% | |
---|---|---|---|---|---|
Conservative | B. Wake | 787 | 67.4 | ||
Alliance | J. Jones | 199 | 17.1 | ||
Labour | C. Neff | 181 | 15.5 | ||
Turnout | 1,167 | 58.0 | |||
Conservative win (new seat) |
Party | Candidate | Votes | % | ±% | |
---|---|---|---|---|---|
Conservative | S. Clark | 1,003 | 42.2 | ||
Conservative | R. Hyde | 970 | 40.8 | ||
Conservative | M. Stupple | 967 | 40.7 | ||
Labour | D. Ayris | 961 | 40.4 | ||
Labour | R. Ward | 847 | 35.6 | ||
Labour | F. Garrick | 810 | 34.1 | ||
Alliance | P. Smith | 416 | 17.5 | ||
Alliance | T. Bowers | 355 | 14.9 | ||
Alliance | G. Seagrave | 316 | 13.3 | ||
Turnout | 2,378 | 46.6 | |||
Conservative win (new seat) | |||||
Conservative win (new seat) |
Party | Candidate | Votes | % | ±% | |
---|---|---|---|---|---|
Labour | T. Mansell | 1,055 | 45.8 | ||
Labour | E. Gledhill | 962 | 41.7 | ||
Labour | I. Luder | 934 | 40.5 | ||
Alliance | M. Nesbitt | 776 | 33.7 | ||
Alliance | P. Parkhouse | 589 | 25.5 | ||
Alliance | C. Davies | 577 | 25.0 | ||
Conservative | K. Haines | 475 | 20.6 | ||
Conservative | M. Haines | 449 | 19.5 | ||
Conservative | M. Williams | 393 | 17.0 | ||
Turnout | 2,306 | 45.5 | |||
Labour win (new seat) | |||||
Labour win (new seat) |
Party | Candidate | Votes | % | ±% | |
---|---|---|---|---|---|
Conservative | R. Hughes | 864 | 41.3 | ||
Alliance | A. Lennon | 828 | 39.5 | ||
Alliance | M. Evans | 815 | 38.9 | ||
Conservative | R. Kendrick | 807 | 38.5 | ||
Labour | R. Crane | 402 | 19.2 | ||
Labour | P. Barton | 318 | 15.2 | ||
Turnout | 2,094 | 55.3 | |||
Conservative win (new seat) | |||||
Alliance win (new seat) |
Party | Candidate | Votes | % | ±% | |
---|---|---|---|---|---|
Conservative | E. Gough | 573 | 57.2 | ||
Alliance | K. West | 295 | 29.5 | ||
Labour | T. Carroll | 133 | 13.3 | ||
Turnout | 1,001 | 60.0 | |||
Conservative win (new seat) |
Party | Candidate | Votes | % | ±% | |
---|---|---|---|---|---|
Alliance | J. Lennon | 1,424 | 47.9 | ||
Alliance | J. Marsh | 1,315 | 44.2 | ||
Conservative | J. Moore | 1,304 | 43.9 | ||
Alliance | C. Swann-Price | 1,298 | 43.7 | ||
Conservative | B. Purbrick | 1,271 | 42.8 | ||
Conservative | C. Woods | 1,238 | 41.7 | ||
Labour | D. Jones | 243 | 8.2 | ||
Labour | L. Holden | 232 | 7.8 | ||
Labour | R. Vant | 204 | 6.9 | ||
Turnout | 2,972 | 54.8 | |||
Alliance win (new seat) | |||||
Conservative win (new seat) |
Party | Candidate | Votes | % | ±% | |
---|---|---|---|---|---|
Labour | J. George | 1,464 | 59.4 | ||
Labour | D. Jones | 1,396 | 56.6 | ||
Labour | M. Cotter | 1,329 | 53.9 | ||
Conservative | P. Mayes | 754 | 30.6 | ||
Conservative | J. Phillips | 718 | 29.1 | ||
Conservative | A. Herring | 690 | 28.0 | ||
Alliance | J. Davis-Cooke | 167 | 6.8 | ||
Alliance | G. Davis-Cooke | 164 | 6.7 | ||
Alliance | K. Culbert | 160 | 6.5 | ||
Independent | A. Awan | 80 | 3.2 | ||
Turnout | 2,465 | 47.9 | |||
Labour win (new seat) | |||||
Labour win (new seat) |
Party | Candidate | Votes | % | ±% | |
---|---|---|---|---|---|
Conservative | H. Bone | 695 | 72.8 | ||
Alliance | A. Tulk | 158 | 16.5 | ||
Labour | J. Caldwell | 102 | 10.7 | ||
Turnout | 955 | 55.7 | |||
Conservative win (new seat) |
Party | Candidate | Votes | % | ±% | |
---|---|---|---|---|---|
Conservative | S. Cocksedge | 858 | 76.3 | ||
Alliance | R. Holmes | 137 | 12.2 | ||
Labour | J. Thynne | 129 | 11.5 | ||
Turnout | 1,124 | 60.0 | |||
Conservative win (new seat) |
Party | Candidate | Votes | % | ±% | |
---|---|---|---|---|---|
Independent | P. Merton-Jones | 572 | 73.3 | ||
Alliance | B. Swann-Price | 126 | 16.2 | ||
Labour | M. Bramail | 82 | 10.5 | ||
Turnout | 780 | 44.8 | |||
Independent win (new seat) |
Party | Candidate | Votes | % | ±% | |
---|---|---|---|---|---|
Conservative | R. Pearson | 677 | 64.5 | ||
Alliance | A. Nicholson | 285 | 27.2 | ||
Labour | S. Hunt | 87 | 8.3 | ||
Turnout | 1,049 | 58.9 | |||
Conservative win (new seat) |
Party | Candidate | Votes | % | ±% | |
---|---|---|---|---|---|
Conservative | V. Wisson | 755 | 73.7 | ||
Labour | P. Cox | 174 | 17.0 | ||
Alliance | J. Brown | 95 | 9.3 | ||
Turnout | 1,024 | 47.9 | |||
Conservative win (new seat) |
Party | Candidate | Votes | % | ±% | |
---|---|---|---|---|---|
Independent | D. Perry | 965 | 42.9 | ||
Conservative | M. Bruce | 811 | 36.1 | ||
Independent | P. Quirk | 520 | 23.1 | ||
Labour | D. Lewis | 341 | 15.2 | ||
Labour | A. Quinian | 321 | 14.3 | ||
Alliance | A. Daysh | 129 | 5.7 | ||
Alliance | F. Heraghty | 94 | 4.2 | ||
Turnout | 2,247 | 66.1 | |||
Independent win (new seat) | |||||
Conservative win (new seat) |
Bedfordshire is a ceremonial county in the East of England. It is bordered by Northamptonshire to the north, Cambridgeshire to the north-east, Hertfordshire to the south and the south-east, and Buckinghamshire to the west. The largest settlement is Luton (225,262), and Bedford is the county town.
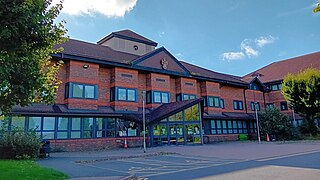
South Bedfordshire was a local government district in Bedfordshire, in the East of England, from 1974 to 2009. Its main towns were Dunstable, Houghton Regis and Leighton Buzzard.
The Borough of Bedford is a unitary authority area with borough status in the ceremonial county of Bedfordshire, England. Its council is based in Bedford, its namesake and principal settlement, which is the county town of Bedfordshire. The Bedford built-up-area is the 71st largest in the United Kingdom and comprises the boundaries of the pre-1974 Bedford Municipal Borough, the town of Kempston and the village of Biddenham, with the BUA surrounded by a rural area with many villages. 75% of the borough's population live in the Bedford Urban Area and the five large villages which surround it, which makes up slightly less than 6% of the total land area of the Borough.
Bedfordshire Police is the territorial police force responsible for policing the ceremonial county of Bedfordshire in England, which includes the unitary authorities of Bedford, Central Bedfordshire and Luton. Its headquarters are in the town of Kempston in Bedford Borough.
Bedford is a constituency represented in the House of Commons of the UK Parliament since 2017 by Mohammad Yasin of the Labour Party.
Mid Bedfordshire is a constituency represented in the House of Commons of the UK Parliament by Alistair Strathern of the Labour Party since a 2023 by-election.
Luton North is a constituency represented in the House of Commons of the UK Parliament since 2019 by Sarah Owen, of the Labour Party.
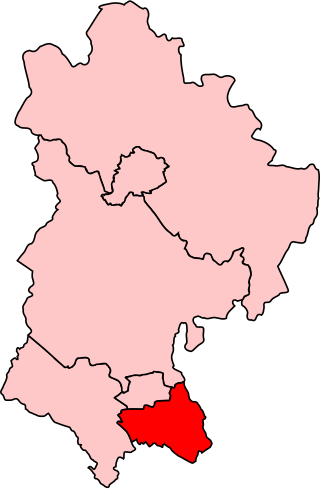
Luton South is a constituency in Bedfordshire represented in the House of Commons of the UK Parliament since 2019 by Rachel Hopkins, a member of the Labour Party.
Bedford Borough Council is the local authority of the Borough of Bedford in Bedfordshire, England. It is a unitary authority, having the powers of a non-metropolitan county and district council combined. The executive of the council is the directly elected mayor of Bedford. It is a member of the East of England Local Government Association.
Bedford Borough Council is the local authority for the unitary authority of Bedford in Bedfordshire, England. Until 1 April 2009 it was a non-metropolitan district. Since 2002 it has also had a directly elected mayor.
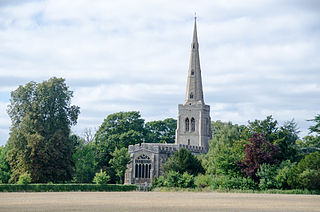
Colmworth is a village and civil parish in the Borough of Bedford in the county of Bedfordshire, England about 6.5 miles (10 km) north-east of Bedford.
North Bedfordshire was a county constituency in Bedfordshire. It returned one Member of Parliament (MP) to the House of Commons of the Parliament of the United Kingdom, elected by the first-past-the-post voting system.
South Bedfordshire was a county constituency in Bedfordshire. It returned one Member of Parliament (MP) to the House of Commons of the Parliament of the United Kingdom, elected by the first past the post system.
Luton Borough Council, also known as Luton Council, is the local authority of Luton, in the ceremonial county of Bedfordshire, England. Luton has had an elected local authority since 1850, which has been reformed several times. Since 1997 the council has been a unitary authority, being a district council which also performs the functions of a county council.
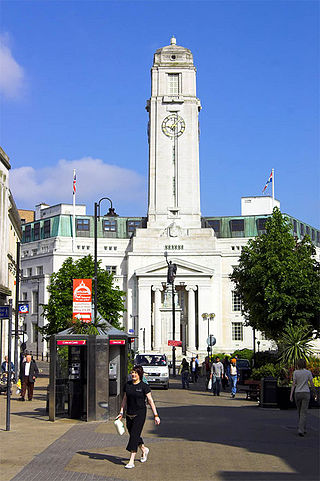
Luton, England, is a unitary authority, and remains part of the ceremonial county of Bedfordshire. Luton is currently represented on three different tiers of Government.
The Mayor of Bedford is a directly elected mayor responsible for the executive function, and ceremonial duty of Bedford Borough Council in Bedfordshire. The incumbent is Tom Wootton of the Conservative Party, elected in May 2023.
Luton Borough Council is the local authority for the unitary authority of Luton in Bedfordshire, England. Until 1 April 1997 it was a non-metropolitan district.
The 2015 United Kingdom local elections were held on Thursday 7 May 2015, the same day as the general election for the House of Commons.
The 1973 North Bedfordshire Borough Council election took place on 10 May 1973 to elect members of North Bedfordshire Borough Council in England. This was the same day as other local elections.