| |||||||||||||||||||||||||||||||||||||||||||||||||||||
53 seats for Whole Council 27 seats needed for a majority | |||||||||||||||||||||||||||||||||||||||||||||||||||||
---|---|---|---|---|---|---|---|---|---|---|---|---|---|---|---|---|---|---|---|---|---|---|---|---|---|---|---|---|---|---|---|---|---|---|---|---|---|---|---|---|---|---|---|---|---|---|---|---|---|---|---|---|---|
Registered | 98,917 | ||||||||||||||||||||||||||||||||||||||||||||||||||||
Turnout | 39% | ||||||||||||||||||||||||||||||||||||||||||||||||||||
| |||||||||||||||||||||||||||||||||||||||||||||||||||||
Results by ward |
Elections to Mid Bedfordshire District Council were held in May 2007. These were the last elections to council, with all 53 seats being up for election. Councillors elected would serve a two-year term, expiring in 2009, when Mid Bedfordshire District Council was replaced by Central Bedfordshire Council. The Conservative Party retained overall control of the council, winning 37 of 53 seats on the council. The Conservatives won 8 seats (5 wards) unopposed, as did an Independent candidate in one ward.
Party | Seats | Gains | Losses | Net gain/loss | Seats % | Votes % | Votes | +/− | |
---|---|---|---|---|---|---|---|---|---|
Conservative | 37 | 6 | 3 | +3 | 69.81 | 47.1 | 16,712 | +5.2 | |
Liberal Democrats | 11 | 1 | 4 | -3 | 20.75 | 30.8 | 10,913 | +6.2 | |
Independent | 4 | 1 | 1 | 0 | 7.55 | 9.7 | 3,429 | +1.6 | |
Green | 1 | 1 | 0 | 1 | 1.89 | 1.7 | 612 | -1.7 | |
Labour | 0 | 0 | 1 | -1 | 0.0 | 10.1 | 3,591 | -11.9 | |
BNP | 0 | 0 | 0 | 0 | 0.0 | 0.6 | 224 | +0.6 |
All results are listed below: [1] [2]
Figures on turnout were taken from Plymouth University's Elections Centre, which gives the number of registered voters, and the percentage turnout for each ward. The number of ballots cast for each ward was calculated from these. Percentage change in turnout is compared with the same ward in the 2003 District Council election.
The percentage of the vote for each candidate was calculated compared with the number of ballots cast in the ward. Note that in a ward with more than one seat, voters were allowed to place as many crosses on the ballot paper as seats. The percentage change for each candidate is compared with the same candidate in the 2003 District Council election.
Candidates who were members of the council before the election are marked with an asterisk.
Asterisks denote incumbent councillors seeking re-election.
One Independent gain from Conservatives. [1]
Party | Candidate | Votes | % | ±% | |
---|---|---|---|---|---|
Liberal Democrats | Gary Summerfield* | 1,381 | 55.2 | −4.0 | |
Liberal Democrats | Michael Pearce | 1,077 | 43.1 | ||
Independent | Mark Smith | 1,060 | 42.4 | +7.0 | |
Conservative | Paul Duckett | 1,035 | 41.4 | ||
Conservative | Richard Holden* | 974 | 38.9 | −2.4 | |
Conservative | Carol Gibson | 939 | 37.5 | ||
Turnout | 2,501 | 46.4 | +9.1 |
One Conservative gain from Independent; one Conservative gain from Labour. [1]
Party | Candidate | Votes | % | ±% | |
---|---|---|---|---|---|
Conservative | Hugh Harper | 562 | 44.0 | ||
Conservative | Ian Dalgarno | 491 | 38.4 | ||
Labour | Dorothy Brown* | 442 | 34.6 | −16.0 | |
Independent | Victor Williams* | 427 | 33.4 | −28.9 | |
Labour | Lorraine Warwick | 275 | 21.5 | ||
Independent | David West | 202 | 15.8 | +2.8 | |
Turnout | 1,277 | 31.1 | +5.7 |
Party | Candidate | Votes | % | ±% | |
---|---|---|---|---|---|
Conservative | Fiona Chapman* [a] | Unopposed | NA |
Party | Candidate | Votes | % | ±% | |
---|---|---|---|---|---|
Conservative | Peter Vickers* | 806 | 60.6 | +19.7 | |
Conservative | David Smith* | 795 | 59.7 | +17.0 | |
Labour | Sheila Grayston | 471 | 35.4 | ||
Labour | Dennis James | 395 | 29.7 | ||
Turnout | 1,331 | 36.3 | +0.8 |
Party | Candidate | Votes | % | ±% | |
---|---|---|---|---|---|
Conservative | Wendy Smith* | 1,015 | 54.0 | ||
Conservative | Jane Lawrence* | 980 | 52.1 | +11.3 | |
Conservative | Maurice Jones* | 914 | 48.6 | +5.7 | |
Labour | Rex Skinner | 697 | 37.1 | +1.5 | |
Labour | Bernard Briars | 680 | 36.2 | −3.3 | |
Labour | David Albone | 678 | 36.0 | ||
Turnout | 1,881 | 32.9 | +5.5 |
Party | Candidate | Votes | % | ±% | |
---|---|---|---|---|---|
Conservative | David Lawrence* | 509 | 48.8 | +2.0 | |
Conservative | Michael Cazaly* | 497 | 47.6 | +1.4 | |
Labour | Amy Forbes | 322 | 30.8 | ||
Labour | Rebecca Kerfoot | 292 | 28.0 | −9.2 | |
BNP | Philippa Carter | 224 | 21.5 | ||
Turnout | 1,044 | 38.1 | +11.8 |
Party | Candidate | Votes | % | ±% | |
---|---|---|---|---|---|
Conservative | Anthony Rogers* | 1,143 | 71.1 | +14.7 | |
Conservative | Paul Carne* | 1,112 | 69.2 | +16.4 | |
Labour | David Devereux | 357 | 22.2 | +1.2 | |
Turnout | 1,608 | 44.6 | +4.9 |
Party | Candidate | Votes | % | ±% | |
---|---|---|---|---|---|
Conservative | Alan Bastable* | 873 | 62.9 | +2.8 | |
Conservative | Kenneth Matthews* | 867 | 62.5 | −0.4 | |
Labour | Alan Morris | 429 | 30.9 | −0.5 | |
Labour | Laurence Pollock | 411 | 29.6 | +0.5 | |
Turnout | 1,387 | 32.7 | +4.0 |
One Green gain from Conservatives. [1]
Party | Candidate | Votes | % | ±% | |
---|---|---|---|---|---|
Green | Richard Ellis | 612 | 64.4 | +18.8 | |
Conservative | David Thompson* | 334 | 35.1 | −19.4 | |
Turnout | 951 | 54.0 | +17.1 |
Party | Candidate | Votes | % | ±% | |
---|---|---|---|---|---|
Liberal Democrats | Stephen Mitchell* | 883 | 56.1 | ||
Liberal Democrats | John Watton* | 766 | 48.6 | +11.4 | |
Conservative | Victor Lee | 633 | 40.2 | ||
Conservative | Sohail Aslam | 478 | 30.3 | ||
Turnout | 1,575 | 35.6 | +7.0 |
Party | Candidate | Votes | % | ±% | |
---|---|---|---|---|---|
Conservative | Stephen Male* | 1,283 | 65.9 | +10.1 | |
Conservative | Dennis Gale* | 1,191 | 61.2 | +0.2 | |
Conservative | David Bayntun | 1,067 | 54.8 | ||
Liberal Democrats | Isobel Mason | 715 | 36.7 | ||
Turnout | 1,947 | 33.6 | +5.0 |
Party | Candidate | Votes | % | ±% | |
---|---|---|---|---|---|
Liberal Democrats | Brian Golby* | 739 | 72.2 | −14.4 | |
Conservative | Margaret Moriondo | 216 | 21.1 | ||
Labour | Margaret Brown | 66 | 6.4 | ||
Turnout | 1,024 | 57.0 | +8.8 |
One Conservative gain from Liberal-Democrats. [1]
Party | Candidate | Votes | % | ±% | |
---|---|---|---|---|---|
Liberal Democrats | Anthony Baines | 777 | 53.2 | +29.1 | |
Conservative | Angela Barker | 670 | 45.9 | ||
Liberal Democrats | John Goode | 613 | 42.0 | ||
Conservative | Alan Carter | 569 | 38.9 | ||
Turnout | 1,461 | 45.8 |
Two Conservative gains from Liberal-Democrats.
Party | Candidate | Votes | % | ±% | |
---|---|---|---|---|---|
Conservative | Jonathan Clarke | 966 | 66.1 | ||
Conservative | Zain Haider | 862 | 47.5 | ||
Liberal Democrats | William Cliff* | 822 | 45.3 | −0.9 | |
Liberal Democrats | Francis Hendrix | 744 | 41.0 | ||
Turnout | 0 | 0.0 | +3.0 |
Party | Candidate | Votes | % | ±% | |
---|---|---|---|---|---|
Conservative | Darren Tysoe* | 846 | 59.5 | −4.4 | |
Conservative | Michael Gibson | 598 | 42.0 | ||
Liberal Democrats | Ian Booth | 482 | 33.9 | ||
Independent | Iain Clapham | 454 | 31.9 | ||
Turnout | 1,423 | 33.4 | +7.0 |
Party | Candidate | Votes | % | ±% | |
---|---|---|---|---|---|
Conservative | Martin Hawkins* | Unopposed | NA | ||
Conservative | Howard Lockey* | Unopposed | NA |
Party | Candidate | Votes | % | ±% | |
---|---|---|---|---|---|
Conservative | Joanna Davison* | 1,102 | 70.4 | ||
Conservative | Patricia Turner* | 1,034 | 66.1 | ||
Liberal Democrats | Gail Davis | 440 | 28.1 | ||
Turnout | 1,565 | 44.4 |
Party | Candidate | Votes | % | ±% | |
---|---|---|---|---|---|
Conservative | Doreen Gurney* | Unopposed | NA | ||
Conservative | Anita Lewis* | Unopposed | NA | ||
Conservative | John Lewis* | Unopposed | NA |
Party | Candidate | Votes | % | ±% | |
---|---|---|---|---|---|
Liberal Democrats | Peter Blaine* | 773 | 55.2 | −6.1 | |
Independent | John Gurney* | 727 | 51.9 | −12.9 | |
Conservative | Robert Smith | 537 | 38.3 | +15.5 | |
Conservative | Douglas McIlwain | 484 | 34.5 | ||
Turnout | 1,401 | 40.9 | +10.3 |
Party | Candidate | Votes | % | ±% | |
---|---|---|---|---|---|
Liberal Democrats | Peter Aldis* | 1,016 | 54.2 | +9.4 | |
Liberal Democrats | Mark Butler | 900 | 48.0 | ||
Independent | Kenneth Lynch | 761 | 40.6 | ||
Liberal Democrats | Geoffrey White | 737 | 39.3 | ||
Conservative | Rachel Smith | 658 | 35.1 | ||
Turnout | 1,876 | 36.2 | +7.2 |
Party | Candidate | Votes | % | ±% | |
---|---|---|---|---|---|
Conservative | Lewis Birt* | 1,237 | 57.8 | +8.0 | |
Conservative | Anthony Brown* | 1,117 | 52.2 | +4.5 | |
Liberal Democrats | Mark Chapman* | 1,016 | 47.5 | +5.9 | |
Conservative | Richard Stidolph | 939 | 43.9 | ||
Labour | Carolyn Devereux | 424 | 19.8 | −11.5 | |
Turnout | 2,141 | 38.6 | +7.3 |
One Liberal-Democrat gain from Conservatives. [1]
Party | Candidate | Votes | % | ±% | |
---|---|---|---|---|---|
Conservative | Rita Drinkwater* | 1,018 | 60.5 | −9.9 | |
Liberal Democrats | Alison Graham | 886 | 52.7 | ||
Conservative | Anthony Whiteman* | 649 | 38.6 | −19.3 | |
Turnout | 1,682 | 38.3 | +5.8 |
Party | Candidate | Votes | % | ±% | |
---|---|---|---|---|---|
Conservative | Kathleen Keen* | Unopposed | NA |
One Conservative gain from Liberal-Democrats. [1]
Party | Candidate | Votes | % | ±% | |
---|---|---|---|---|---|
Conservative | John Street* | 1,268 | 61.1 | +2.9 | |
Conservative | Christina Turner | 1,158 | 55.8 | ||
Conservative | John Saunders* | 1,012 | 48.8 | +0.0 | |
Liberal Democrats | Brian Collier* | 983 | 47.4 | −10.7 | |
Labour | Allister Dennis | 383 | 18.5 | ||
Turnout | 2,074 | 36.2 | +2.5 |
Party | Candidate | Votes | % | ±% | |
---|---|---|---|---|---|
Independent | Andrew Rayment* [b] | Unopposed | NA |
Party | Candidate | Votes | % | ±% | |
---|---|---|---|---|---|
Conservative | Budge Wells | Unopposed | NA |
The 2006 Barnet Council election took place on 4 May 2006 to elect members of Barnet London Borough Council in London, England. The whole council was up for election and the Conservative Party stayed in overall control of the council.
Thanet District Council elections are held every four years to elect Thanet District Council in Kent, England. Since the last boundary changes in 2003 the council has comprised 56 councillors representing 23 wards.
Sheffield City Council elections took place on Thursday 3 May 2012 as part of the 2012 United Kingdom local elections.
Elections to Aberdeenshire Council were held on 3 May 2012, on the same day as the other Scottish local government elections. The election used the 19 wards created as a result of the Local Governance (Scotland) Act 2004, with each ward electing three or four Councillors using the single transferable vote system form of proportional representation, with 68 Councillors being elected.
Luton Borough Council is the local authority for the unitary authority of Luton in Bedfordshire, England. Until 1 April 1997 it was a non-metropolitan district.
Elections to Central Bedfordshire Council were held on 7 May 2015, along with the 2015 United Kingdom general election and other local elections. The whole council was up for election, with each successful candidate serving a four-year term of office, expiring in 2019.
Elections to Aberdeenshire Council were held on 4 May 2017, on the same day as the other Scottish local government elections. The election used the 19 wards created as a result of the Local Governance (Scotland) Act 2004, with each ward electing three or four councillors using the single transferable vote system form of proportional representation, with 70 councillors being elected, an increase of two members compared to 2012.
The 2011 Central Bedfordshire Council electionfor the Central Bedfordshire Council were held on 5 May 2011, along with other United Kingdom local elections. The whole council was up for election following boundary changes, with each successful candidate serving a four-year term of office, expiring in 2015.
Elections to Mid Bedfordshire District Council were held on 1 May 2003. All 53 seats were up for election. Councillors elected would serve a four-year term, expiring in 2007. The Conservative Party retained overall control of the council, winning 37 of 53 seats on the council. The Conservatives won 7 seats unopposed.
Elections to Mid Bedfordshire District Council were held on 6 May 1999. All 53 seats were up for election. The Conservative Party gained overall control of the council, increasing their number of seats from 22 to 34, whilst the Labour Party declined from having 20 seats in 1995 to 7.
Elections to Mid Bedfordshire District Council were held on 4 May 1995. All 53 seats were up for election.
Elections to Mid Bedfordshire District Council were held on 2 May 1991. All 53 seats were up for election.
Elections to Mid Bedfordshire District Council were held on 7 May 1987. All 53 seats were up for election.
Elections to Mid Bedfordshire District Council were held on 5 May 1983. All 53 seats were up for election.
Elections to Mid Bedfordshire District Council were held on 3 May 1979, on the same day as the general election, so turnout was higher than usual in district council elections for Mid Bedfordshire. All 53 seats were up for election.
Elections to Mid Bedfordshire District Council in Mid Bedfordshire, England, were held in May 1976. All 53 seats were up for election.
Elections to The Highland Council were held on 5 May 2022, the same day as the 31 other Scottish local government elections. As with other Scottish council elections, it was held using single transferable vote (STV) – a form of proportional representation – in which multiple candidates are elected in each ward and voters rank candidates in order of preference.
Elections to Dumfries and Galloway Council took place on 5 May 2022 on the same day as the 31 other Scottish local government elections. As with other Scottish council elections, it was held using single transferable vote (STV) – a form of proportional representation – in which multiple candidates are elected in each ward and voters rank candidates in order of preference.
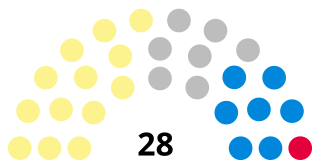
Elections to Angus Council took place on 5 May 2022, the same day as the 31 other Scottish local government elections. As with other Scottish council elections, it was held using single transferable vote (STV) – a form of proportional representation – in which multiple candidates are elected in each ward and voters rank candidates in order of preference.
Elections to Aberdeenshire Council took place on Thursday 5 May 2022 on the same day as the 31 other Scottish local government elections. As with other Scottish council elections, it was held using single transferable vote (STV) – a form of proportional representation – in which multiple candidates are elected in each ward and voters rank candidates in order of preference.