2007 West Oxfordshire District Council election

Last updated

Map of the results of the 2007 West Oxfordshire District Council election. Conservatives in blue, Liberal Democrats in yellow, Labour in red and Independent in light grey. Wards in dark grey were not contested in 2007. West Oxfordshire UK local election 2007 map.svg
Map of the results of the 2007 West Oxfordshire District Council election. Conservatives in blue, Liberal Democrats in yellow, Labour in red and Independent in light grey. Wards in dark grey were not contested in 2007.

The 2007 West Oxfordshire District Council election took place on 3 May 2007 to elect members of West Oxfordshire District Council in Oxfordshire, England. One third of the council was up for election and the Conservative Party stayed in overall control of the council. [1]

Contents

After the election, the composition of the council was:

Background

After the 2006 election the Conservatives controlled the council with 34 councillors, while the Liberal Democrats had nine, there were five Independents and Labour had one seat. [4] 16 seats were to be contested in 2007, but on 21 April 2007 the chairman of West Oxfordshire District Council, Conservative Keith Stone, died. [5] [6] As a result, the election in his ward where he had been standing for re-election, Carterton North East, was postponed until 21 June. [7]

For the 15 seats therefore contested on 3 May 2007, the Conservatives had 14 candidates, both the Liberal Democrats and Greens had 11, Labour had five, the UK Independence Party had two and there were two Independents. [8] 11 sitting councillors sought re-election, with these including the only Labour councillor in West Oxfordshire, Eve Coles. [8] [9] There was no contest in Alvescot and Filkins ward, with Conservative David McFarlane being elected without opposition. [8] [10]

Election result

The Conservatives made a net gain of two seats to win 10 of the 15 seats elected on 3 May. [2] This took the Conservatives to 35 seats on the council and a majority of 22. [10] The Conservatives gained three seats in Witney, in Witney Central, Witney East and Witney North wards, to win all five seats contested in the town and meant that only one councillor in Witney was not Conservative, independent Peter Green who had been elected as a Conservative. [2] [10] However the Conservatives lost a seat in Carterton South to the Liberal Democrats by a single vote. [2]

Despite the gain in Carterton South the Liberal Democrats dropped to eight councillors, after losing two seats in Witney and received fewer votes than Labour in Witney. [10] Labour retained their only seat on the council after Eve Cole held Chipping Norton by 163 votes. [10] The number of independent councillors was reduced to four after the election, while overall eight of the 11 councillors who stood again held their seats. [10] [8] Overall turnout at the election was 38.22%, reaching a high of 51.12% in Charlbury ward. [8]

The Conservatives won a further seat in the delayed election in Carterton North East on 21 June, which was held for the party by Norman Macrae with a majority of 296 votes over independent Paul Wesson. [3]

West Oxfordshire local election result 2007 [8]
PartySeatsGainsLossesNet gain/lossSeats %Votes %Votes+/−
  Conservative 1131+268.852.410,151-7.2%
  Liberal Democrats 312-118.819.33,745-0.7%
  Labour 10006.39.61,855+0.3%
  Independent 101-16.36.71,300+0.1%
  Green 0000010.62,059+6.1%
  UKIP 000001.3260+1.3%

The above totals include the delayed election in Carterton North East.

Ward results

Alvescot and Filkins [8]
PartyCandidateVotes%±%
Conservative David McFarlaneunopposed
Conservative hold Swing
Bampton and Clanfield [8]
PartyCandidateVotes%±%
Conservative Mark Booty1,00778.4+40.9
Liberal Democrats Gill Workman15512.1+12.1
Green Gill Edmonds1239.6+9.6
Majority85266.3
Turnout 1,28545.2-6.7
Conservative hold Swing
Carterton North West [8]
PartyCandidateVotes%±%
Conservative Pete Handley78474.8-9.0
Liberal Democrats John Lilly26425.2+25.2
Majority52049.6-18.1
Turnout 1,04833.0+1.8
Conservative hold Swing
Carterton South [8]
PartyCandidateVotes%±%
Liberal Democrats Peter Madden49350.1+31.3
Conservative Harry Watts49249.9-31.3
Majority10.2
Turnout 98533.5-11.4
Liberal Democrats gain from Conservative Swing
Charlbury and Finstock [8]
PartyCandidateVotes%±%
Liberal Democrats Mike Breakell79052.8-13.9
Conservative Gill Hill57938.7+5.4
Green Harriet Marshall1288.6+8.6
Majority21114.1-19.4
Turnout 1,49751.2+0.3
Liberal Democrats hold Swing
Chipping Norton [8]
PartyCandidateVotes%±%
Labour Eve Coles95847.3+20.1
Conservative Michael Tysoe79539.3-21.7
Independent Keith Greenwell27213.4+13.4
Majority1638.0
Turnout 2,02542.9+0.1
Labour hold Swing
Eynsham and Cassington [8]
PartyCandidateVotes%±%
Liberal Democrats Richard Andrews91049.1+8.9
Conservative Jane Doughty68537.0-8.6
UKIP Jonathan Miller1347.2+7.2
Green Xanthe Bevis1246.7-1.7
Majority22512.1
Turnout 1,85342.1-0.1
Liberal Democrats hold Swing
Hailey, Minster Lovell and Leafield [8]
PartyCandidateVotes%±%
Conservative Warwick Robinson80967.8-0.5
Liberal Democrats Elizabeth Mortimer23019.3-2.9
Green Andrew Coles15513.0+13.0
Majority57948.5+2.4
Turnout 1,19438.6-6.3
Conservative hold Swing
Kingham, Rollright and Enstone [8]
PartyCandidateVotes%±%
Conservative Andrew Beaney88568.7+6.6
Labour Melanie Deans15111.7-6.4
Green Brian Luney13210.2+10.2
Liberal Democrats Christopher Tatton1219.4-10.4
Majority73456.9+14.5
Turnout 1,28941.3-4.7
Conservative hold Swing
Stonesfield and Tackley [8]
PartyCandidateVotes%±%
Independent Charles Cottrell-Dormer89571.0+1.7
Green Susan Turnbull36529.0+14.6
Majority53042.1-10.9
Turnout 1,26040.0-8.8
Independent hold Swing
Witney Central [8]
PartyCandidateVotes%±%
Conservative Nick Buckle56953.4+10.5
Labour Phillip Edney20118.9-8.8
Liberal Democrats Brenda Churchill17216.1-1.7
Green Sandra Simpson12411.60.0
Majority36834.5+19.4
Turnout 1,06633.3-7.8
Conservative gain from Independent Swing
Witney East [8]
PartyCandidateVotes%±%
Conservative Alan Davies95957.7-3.2
Labour Duncan Enright28016.8+9.0
Liberal Democrats David Nicholson24214.6-2.9
Green Enid Dossett-Davies18210.9-2.9
Majority67940.8-2.7
Turnout 1,66333.1-1.1
Conservative gain from Liberal Democrats Swing
Witney North [8]
PartyCandidateVotes%±%
Conservative Richard Langridge58851.4+6.2
Green Richard Dossett-Davies36832.1+6.4
Liberal Democrats Serena Martin18916.5-2.5
Majority22019.2-0.2
Turnout 1,14537.0-4.1
Conservative gain from Liberal Democrats Swing
Witney South [8]
PartyCandidateVotes%±%
Conservative Alvin Adams84955.2-5.7
Labour David Wesson21514.0-1.9
Liberal Democrats June Taylor17911.6-1.7
Green Jill Jones16911.0+1.1
UKIP David Phipps1268.2+8.2
Majority63441.2-3.9
Turnout 1,53834.7+0.5
Conservative hold Swing
Witney West [8]
PartyCandidateVotes%±%
Conservative Harry Eaglestone72379.3+28.0
Green Stephen Mohammad18920.7+11.6
Majority53458.6+34.1
Turnout 91230.8-6.2
Conservative hold Swing

Carterton North East delayed election

Carterton North East [8]
PartyCandidateVotes%±%
Conservative Norman Macrae42770.0+7.9
Independent Paul Wesson13321.8-16.1
Labour David Wesson508.2+8.2
Majority29448.2+24.1
Turnout 61017.8-7.5
Conservative hold Swing

Related Research Articles

<span class="mw-page-title-main">Witney (UK Parliament constituency)</span> Parliamentary constituency in the United Kingdom since 1983

Witney is a county constituency in Oxfordshire represented in the House of Commons of the Parliament of the United Kingdom since 2016 by Robert Courts of the Conservative Party. It elects one Member of Parliament by the first-past-the-post system of election, and was created for the 1983 general election.

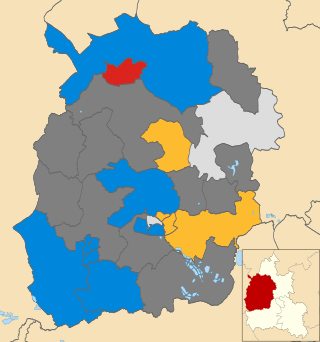
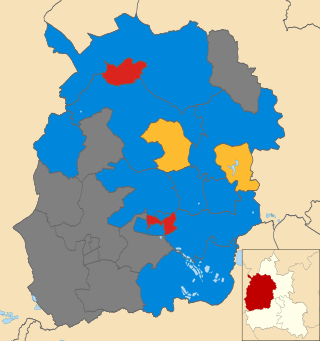
The 1999 Craven District Council election took place on 6 May 1999 to elect members of Craven District Council in North Yorkshire, England. One third of the council was up for election and the Conservative Party gained overall control of the council from no overall control.

The 2000 Craven District Council election took place on 4 May 2000 to elect members of Craven District Council in North Yorkshire, England. One third of the council was up for election and the Conservative Party stayed in overall control of the council.

<span class="mw-page-title-main">2007 St Helens Metropolitan Borough Council election</span> Council election in Merseyside, England

The 2007 St Helens Metropolitan Borough Council election took place on 3 May 2007 to elect members of St Helens Metropolitan Borough Council in Merseyside, England. One third of the council was up for election and the council stayed under no overall control.

<span class="mw-page-title-main">2007 St Albans City and District Council election</span>

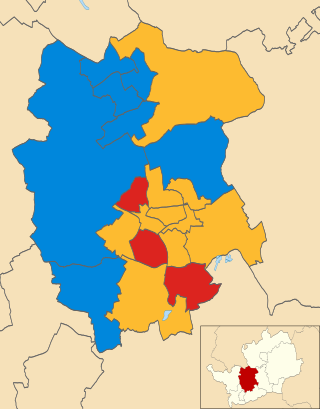
The 2007 St Albans City and District Council election took place on 3 May 2007 to elect members of St Albans District Council in Hertfordshire, England. One third of the council was up for election and the Liberal Democrats lost overall control of the council to no overall control.

<span class="mw-page-title-main">2007 Colchester Borough Council election</span>

The 2007 Colchester Borough Council election took place on 3 May 2007 to elect members of Colchester Borough Council in Essex, England. One third of the council was up for election and the council stayed under no overall control.

<span class="mw-page-title-main">2011 Swale Borough Council election</span>

The 2011 Swale Borough Council election took place on 5 May 2011 to elect members of Swale Borough Council in Kent, England. The whole council was up for election and the Conservative Party stayed in overall control of the council.

<span class="mw-page-title-main">2003 Wychavon District Council election</span>

The 2003 Wychavon District Council election took place on 1 May 2003 to elect members of Wychavon District Council in Worcestershire, England. The whole council was up for election with boundary changes since the last election in 1999 reducing the number of seats by four. The Conservative party stayed in overall control of the council.

<span class="mw-page-title-main">2007 Wychavon District Council election</span>

The 2007 Wychavon District Council election took place on 3 May 2007 to elect members of Wychavon District Council in Worcestershire, England. The whole council was up for election and the Conservative party stayed in overall control of the council.

The 2000 West Oxfordshire District Council election took place on 4 May 2000 to elect members of West Oxfordshire District Council in Oxfordshire, England. One third of the council was up for election and the Conservative Party gained overall control of the council from no overall control.

<span class="mw-page-title-main">2002 West Oxfordshire District Council election</span>

The 2002 West Oxfordshire District Council election took place on 2 May 2002 to elect members of West Oxfordshire District Council in Oxfordshire, England. The whole council was up for election with boundary changes since the last election in 2000. The Conservative Party stayed in overall control of the council.

<span class="mw-page-title-main">2003 West Oxfordshire District Council election</span>

The 2003 West Oxfordshire District Council election took place on 1 May 2003 to elect members of West Oxfordshire District Council in Oxfordshire, England. One third of the council was up for election and the Conservative Party stayed in overall control of the council.

<span class="mw-page-title-main">2004 West Oxfordshire District Council election</span>

The 2004 West Oxfordshire District Council election took place on 10 June 2004 to elect members of West Oxfordshire District Council in Oxfordshire, England. One third of the council was up for election and the Conservative Party stayed in overall control of the council.

<span class="mw-page-title-main">2006 West Oxfordshire District Council election</span>

The 2006 West Oxfordshire District Council election took place on 4 May 2006 to elect members of West Oxfordshire District Council in Oxfordshire, England. One third of the council was up for election and the Conservative Party stayed in overall control of the council.

<span class="mw-page-title-main">2008 West Oxfordshire District Council election</span>

The 2008 West Oxfordshire District Council election took place on 1 May 2008 to elect members of West Oxfordshire District Council in Oxfordshire, England. One third of the council was up for election and the Conservative Party stayed in overall control of the council.

<span class="mw-page-title-main">2011 West Oxfordshire District Council election</span>

The 2011 West Oxfordshire District Council election took place on 5 May 2011 to elect members of West Oxfordshire District Council in Oxfordshire, England. One third of the council was up for election and the Conservative Party stayed in overall control of the council.

<span class="mw-page-title-main">2012 West Oxfordshire District Council election</span>

The 2012 West Oxfordshire District Council election took place on 3 May 2012 to elect members of West Oxfordshire District Council in Oxfordshire, England. One third of the council was up for election and the Conservative Party stayed in overall control of the council.

<span class="mw-page-title-main">2014 West Oxfordshire District Council election</span>

The 2014 West Oxfordshire District Council election took place on 22 May 2014 to elect members of West Oxfordshire District Council in Oxfordshire, England. One third of the council was up for election and the Conservative Party stayed in overall control of the council.

<span class="mw-page-title-main">2015 West Oxfordshire District Council election</span>

The 2015 West Oxfordshire District Council election took place on 22 May 2015 to elect members of West Oxfordshire District Council in Oxfordshire, England. One third of the council was up for election and the Conservative Party stayed in overall control of the council.

On 20 October 2016, a by-election was held in the UK parliamentary constituency of Witney. It took place on the same day as the Batley and Spen by-election. They were the fifth and sixth by-elections of the 56th UK Parliament.

References

  1. "West Oxfordshire". BBC News Online. 4 May 2007. Retrieved 12 August 2015.
  2. 1 2 3 4 "Tories increase dominance of West Oxon". Banbury Guardian . 4 May 2007. Retrieved 14 August 2015.
  3. 1 2 "Tories win by-election". Oxfordshire County Publications. NewsBank. 22 June 2007.
  4. "Local elections: West Oxfordshire". BBC News Online. 5 May 2006. Retrieved 14 August 2015.
  5. "Election fever set to hot up". Oxfordshire County Publications. NewsBank. 13 April 2007.
  6. "Elections results are expected early on Friday". Oxfordshire County Publications. NewsBank. 1 May 2007.
  7. "Carterton North East: Three candidates to choose from". Oxfordshire County Publications. NewsBank. 1 June 2007.
  8. 1 2 3 4 5 6 7 8 9 10 11 12 13 14 15 16 17 18 19 20 21 22 "West Oxfordshire District Council Election Results 1998 - 2010" (PDF). West Oxfordshire District Council. Archived from the original (PDF) on 5 October 2015. Retrieved 12 August 2015.
  9. "Blair braced to lose 500 council seats in South". The Daily Telegraph . NewsBank. 30 April 2007. p. 10.
  10. 1 2 3 4 5 6 "Tories retain West Oxfordshire". Oxfordshire County Publications. NewsBank. 4 May 2007.