Related Research Articles
The 1998 St Helens Metropolitan Borough Council election took place on 7 May 1998 to elect members of St Helens Metropolitan Borough Council in Merseyside, England. One third of the council was up for election and the Labour Party stayed in overall control of the council.
Huntingdonshire District Council in Cambridgeshire, England holds elections for all its councillors together every fourth year. Prior to changing to all-out elections in 2018, one third of the council was elected each year, followed by one year without an election. Since the last boundary changes in 2018, 52 councillors have been elected from 26 wards.
The 2000 Craven District Council election took place on 4 May 2000 to elect members of Craven District Council in North Yorkshire, England. One third of the council was up for election and the Conservative Party stayed in overall control of the council.

One third of West Oxfordshire District Council in Oxfordshire, England is elected each year, followed by one year without election. Since the last boundary changes in 2002, there are a total 49 councillors elected from 27 wards, each councillor serving a four-year term.
The 1998 St Albans City and District Council election took place on 7 May 1998 to elect members of St Albans City and District Council in Hertfordshire, England. One third of the council was up for election and the Liberal Democrats stayed in overall control of the council.

The 1999 St Albans City and District Council election took place on 6 May 1999 to elect members of St Albans City and District Council in Hertfordshire, England. The whole council was up for election with boundary changes since the last election in 1998 increasing the number of seats by 1. The Liberal Democrats lost overall control of the council to no overall control.

The 2000 St Albans City and District Council election took place on 4 May 2000 to elect members of St Albans District Council in Hertfordshire, England. One third of the council was up for election and the council stayed under no overall control.
The 1998 Wyre Forest District Council election took place on 7 May 1998 to elect members of Wyre Forest District Council in Worcestershire, England. One-third of the council was up for election and the Labour Party stayed in overall control of the council.
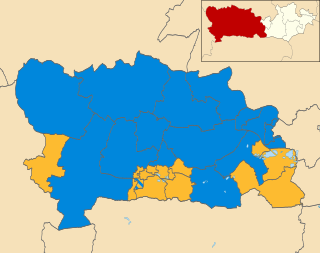
The 1999 Huntingdonshire District Council election took place on 6 May 1999 to elect members of Huntingdonshire District Council in Cambridgeshire, England. One third of the council was up for election and the Conservative Party stayed in overall control of the council.
The 1999 Rother District Council election took place on 6 May 1999 to elect members of Rother District Council in East Sussex, England. The whole council was up for election and the Conservative Party gained overall control of the council from no overall control.

The 2011 Bolsover District Council election took place on 5 May 2011 to elect members of Bolsover District Council in Derbyshire, England. The whole council was up for election and the Labour Party stayed in overall control of the council.
The 2003 West Berkshire Council election took place on 1 May 2003 to elect members of West Berkshire Council in Berkshire, England. The whole council was up for election with boundary changes since the last election in 2000 reducing the number of seats by two. The Liberal Democrats lost overall control of the council to no overall control.
The 1999 South Kesteven District Council election took place on 6 May 1999 to elect members of South Kesteven District Council in Lincolnshire, England. The whole council was up for election with boundary changes since the last election in 1995. The council stayed under no overall control.
The 1998 West Oxfordshire District Council election took place on 7 May 1998 to elect members of West Oxfordshire District Council in Oxfordshire, England. One third of the council was up for election and the council stayed under no overall control.
The 2000 West Oxfordshire District Council election took place on 4 May 2000 to elect members of West Oxfordshire District Council in Oxfordshire, England. One third of the council was up for election and the Conservative Party gained overall control of the council from no overall control.

The 2002 West Oxfordshire District Council election took place on 2 May 2002 to elect members of West Oxfordshire District Council in Oxfordshire, England. The whole council was up for election with boundary changes since the last election in 2000. The Conservative Party stayed in overall control of the council.

The 2006 West Oxfordshire District Council election took place on 4 May 2006 to elect members of West Oxfordshire District Council in Oxfordshire, England. One third of the council was up for election and the Conservative Party stayed in overall control of the council.

The 2007 West Oxfordshire District Council election took place on 3 May 2007 to elect members of West Oxfordshire District Council in Oxfordshire, England. One third of the council was up for election and the Conservative Party stayed in overall control of the council.

The 2011 West Oxfordshire District Council election took place on 5 May 2011 to elect members of West Oxfordshire District Council in Oxfordshire, England. One third of the council was up for election and the Conservative Party stayed in overall control of the council.

The 2015 West Oxfordshire District Council election took place on 22 May 2015 to elect members of West Oxfordshire District Council in Oxfordshire, England. One third of the council was up for election and the Conservative Party stayed in overall control of the council.
References
- ↑ "How the nations voted". The Times . NewsBank. 8 May 1999. p. 48.
- ↑ "Britain votes: Local Council Election Results". The Independent . NewsBank. 7 May 1999.
- 1 2 3 4 5 6 7 8 9 10 11 12 13 14 15 16 17 "West Oxfordshire District Council Election Results 1998 - 2010" (PDF). West Oxfordshire District Council. Archived from the original (PDF) on 5 October 2015. Retrieved 4 August 2015.
- ↑ "Local Authority Byelection Results - September 1999". Local Authority Byelection Results. Archived from the original on 10 August 2014. Retrieved 5 August 2015.