Elections to Watford Borough Council were held on 6 May 1999. The whole council was up for election with boundary changes since the last election in 1998. The Labour party stayed in overall control of the council.
1999 Watford Borough Council election | ||||||||||
---|---|---|---|---|---|---|---|---|---|---|
Party | This election | Full council | This election | |||||||
Seats | Net | Seats % | Other | Total | Total % | Votes | Votes % | +/− | ||
Labour | 19 | ![]() | 52.8 | 0 | 19 | 52.8 | 22,539 | 37.9 | -1.2 | |
Liberal Democrats | 11 | ![]() | 30.6 | 0 | 11 | 30.6 | 18,588 | 31.3 | -1.1 | |
Conservative | 6 | ![]() | 16.7 | 0 | 6 | 16.7 | 18,337 | 30.8 | +2.3 | |
Party | Candidate | Votes | % | ||
---|---|---|---|---|---|
Labour | M. Cash | 628 | 48.0 | ||
Labour | F. Hodgson | 605 | 46.3 | ||
Labour | P. Harrison | 594 | 45.4 | ||
Conservative | R. Downham | 421 | 32.2 | ||
Conservative | T. Needham | 414 | 31.7 | ||
Conservative | M. Taylor | 405 | 31.0 | ||
Liberal Democrats | C. Bradshaw | 247 | 18.9 | ||
Liberal Democrats | H. Finn | 229 | 17.5 | ||
Liberal Democrats | A. Vincent | 198 | 15.1 | ||
Turnout | 1,307 | 26.5 | |||
Labour hold | |||||
Labour hold | |||||
Labour hold | |||||
Party | Candidate | Votes | % | ||
---|---|---|---|---|---|
Labour | R. Atkin | 856 | 46.2 | ||
Labour | V. Muspratt | 799 | 43.1 | ||
Liberal Democrats | R. Martins | 797 | 43.0 | ||
Liberal Democrats | J. Baddeley | 754 | 40.7 | ||
Liberal Democrats | K. Soodin | 731 | 39.5 | ||
Labour | N. Tester | 725 | 39.1 | ||
Conservative | A. Bell | 163 | 8.8 | ||
Conservative | T. Parsons | 146 | 7.9 | ||
Conservative | G. Ogden | 137 | 7.4 | ||
Turnout | 1,852 | 37.3 | |||
Labour hold | |||||
Labour hold | |||||
Liberal Democrats gain from Labour |
Party | Candidate | Votes | % | ||
---|---|---|---|---|---|
Labour | R. Bell | 779 | 60.3 | ||
Labour | S. Palmer | 761 | 58.9 | ||
Labour | A. Head | 726 | 56.2 | ||
Conservative | R. Frost | 247 | 19.1 | ||
Conservative | H. Ling | 234 | 18.1 | ||
Liberal Democrats | E. Watkin | 228 | 17.6 | ||
Liberal Democrats | M. Allen | 228 | 17.6 | ||
Liberal Democrats | P. Purdy | 223 | 17.3 | ||
Conservative | A. Sander | 215 | 16.6 | ||
Turnout | 1,292 | 25.6 | |||
Labour hold | |||||
Labour hold | |||||
Labour hold | |||||
Party | Candidate | Votes | % | ||
---|---|---|---|---|---|
Labour | M. Green | 842 | 42.7 | ||
Labour | K. Court | 841 | 42.6 | ||
Conservative | S. O'Brien | 820 | 41.6 | ||
Labour | E. Muspratt | 815 | 41.3 | ||
Conservative | D. Hobbs | 789 | 40.0 | ||
Conservative | G. Ling | 754 | 38.2 | ||
Liberal Democrats | P. Brown | 257 | 13.0 | ||
Liberal Democrats | S. Gibbard | 224 | 11.4 | ||
Liberal Democrats | M. Taylor | 200 | 10.1 | ||
Turnout | 1,973 | 38.2 | |||
Labour hold | |||||
Labour hold | |||||
Conservative hold | |||||
Party | Candidate | Votes | % | ||
---|---|---|---|---|---|
Labour | N. Tyrwhitt | 819 | 50.2 | ||
Labour | G. O'Connell | 812 | 49.8 | ||
Labour | R. Banham | 802 | 49.2 | ||
Conservative | K. Bell | 492 | 30.2 | ||
Conservative | I. Evans | 457 | 28.0 | ||
Conservative | P. East | 431 | 26.4 | ||
Liberal Democrats | C. Anson | 251 | 15.4 | ||
Liberal Democrats | M. Palmer | 224 | 13.7 | ||
Liberal Democrats | J. Richmond | 215 | 13.2 | ||
Turnout | 1,631 | 30.2 | |||
Labour hold | |||||
Labour hold | |||||
Labour hold | |||||
Party | Candidate | Votes | % | ||
---|---|---|---|---|---|
Conservative | I. Brown | 1,005 | 55.3 | ||
Conservative | J. Brown | 976 | 53.7 | ||
Conservative | S. Jones | 963 | 53.0 | ||
Labour | R. England | 380 | 20.9 | ||
Labour | T. Meldrum | 378 | 20.8 | ||
Liberal Democrats | M. Watkin | 376 | 20.7 | ||
Labour | S. Hince | 371 | 20.4 | ||
Liberal Democrats | J. Wyatt | 338 | 18.6 | ||
Liberal Democrats | T. Wyatt | 291 | 16.0 | ||
Turnout | 1,816 | 36.1 | |||
Conservative hold | |||||
Party | Candidate | Votes | % | ||
---|---|---|---|---|---|
Liberal Democrats | D. Thornhill | 1,158 | 59.0 | ||
Liberal Democrats | I. Sharpe | 1,068 | 54.4 | ||
Liberal Democrats | A. Poole | 1,056 | 53.8 | ||
Conservative | G. Greenstreet | 487 | 24.8 | ||
Conservative | R. Bamford | 441 | 22.5 | ||
Conservative | M. Stanley | 434 | 22.1 | ||
Labour | S. Butler | 290 | 14.8 | ||
Labour | N. Akubue | 278 | 14.2 | ||
Labour | J. Dowdle | 265 | 13.5 | ||
Turnout | 1,964 | 41.8 | |||
Liberal Democrats hold | |||||
Party | Candidate | Votes | % | ||
---|---|---|---|---|---|
Conservative | K. Solomon | 1,214 | 60.0 | ||
Conservative | T. Williams | 1,211 | 59.9 | ||
Conservative | D. Wright | 1,180 | 58.3 | ||
Liberal Democrats | M. Crowne | 477 | 23.6 | ||
Liberal Democrats | C. de Vekey | 441 | 21.8 | ||
Liberal Democrats | R. de Vekey | 406 | 20.1 | ||
Labour | F. Hince | 293 | 14.5 | ||
Labour | M. Jones | 277 | 13.7 | ||
Labour | M. Hussain | 268 | 13.2 | ||
Turnout | 2,023 | 40.8 | |||
Conservative hold | |||||
Party | Candidate | Votes | % | ||
---|---|---|---|---|---|
Liberal Democrats | D. Scudder | 1,090 | 59.9 | ||
Liberal Democrats | J. Richmond | 1,033 | 56.7 | ||
Liberal Democrats | A. Wylie | 983 | 54.0 | ||
Labour | C. Barry | 361 | 19.8 | ||
Conservative | A. Jones | 357 | 19.6 | ||
Conservative | P. Curtis | 356 | 19.5 | ||
Labour | M. Tyrwhitt | 336 | 18.5 | ||
Conservative | P. Jenkins | 334 | 18.3 | ||
Labour | C. Wilson | 332 | 18.2 | ||
Turnout | 1,821 | 36.0 | |||
Liberal Democrats hold | |||||
Party | Candidate | Votes | % | ||
---|---|---|---|---|---|
Labour | S. Ahrens | 804 | 44.8 | ||
Labour | S. Rosser | 787 | 43.9 | ||
Labour | M. Chhina | 708 | 39.5 | ||
Conservative | P. Bell | 661 | 36.8 | ||
Conservative | S. Barclay | 647 | 36.1 | ||
Conservative | J. Price | 626 | 34.9 | ||
Liberal Democrats | A. Oaten | 274 | 15.3 | ||
Liberal Democrats | L. Scudder | 271 | 15.1 | ||
Liberal Democrats | D. Di Laura | 258 | 14.4 | ||
Turnout | 1,794 | 39.2 | |||
Labour hold | |||||
Labour hold | |||||
Labour hold | |||||
Party | Candidate | Votes | % | ||
---|---|---|---|---|---|
Labour | A. Choudhrey | 1,003 | 58.4 | ||
Labour | B. Graham | 976 | 56.9 | ||
Labour | G. Kelly | 944 | 55.0 | ||
Conservative | D. Ealey | 301 | 17.5 | ||
Liberal Democrats | N. Taylor | 301 | 17.5 | ||
Conservative | J. Price | 264 | 15.4 | ||
Liberal Democrats | I. Pitkin | 245 | 14.3 | ||
Conservative | Z. Basit | 245 | 14.3 | ||
Liberal Democrats | A. Zafar | 222 | 12.9 | ||
Turnout | 1,716 | 33.7 | |||
Labour hold | |||||
Labour hold | |||||
Labour hold | |||||
Party | Candidate | Votes | % | ||
---|---|---|---|---|---|
Liberal Democrats | A. Burtenshaw | 1,118 | 53.6 | ||
Liberal Democrats | E. Burtenshaw | 1,112 | 53.3 | ||
Liberal Democrats | A. Garside | 1,064 | 51.0 | ||
Labour | S. Tuckwood | 714 | 34.2 | ||
Labour | J. Young | 694 | 33.3 | ||
Labour | M. Thackham | 676 | 32.4 | ||
Conservative | C. Jeffs | 185 | 8.9 | ||
Conservative | N. Joyce | 170 | 8.2 | ||
Conservative | A. Needham | 155 | 7.4 | ||
Turnout | 2,085 | 40.6 | |||
Liberal Democrats hold | |||||
Liberal Democrats gain from Labour |
Watford Borough Council elections are held three years out of every four, to elect members of Watford Borough Council in Hertfordshire, England. A third of the council is elected each time. Since the last boundary changes in 2016 the council has comprised 36 councillors representing 12 wards, each of which elects three councillors. In addition to the 36 councillors Watford also has a directly-elected mayor. Elections to Hertfordshire County Council are held in the fourth year of the cycle when there are no borough council elections.
Watford, a city in England, held its 1998 Watford Borough Council elections on 7 May. One third of the council was up for election and the Labour party stayed in overall control of the council.
Elections to Watford Borough Council were held on 4 May 2000. One third of the council was up for election and the Labour Party lost overall control of the council to no overall control.
Elections to Watford Borough Council were held on 2 May 2002. One third of the council was up for election and the council stayed under no overall control. At the same time an election for a directly elected mayor was held, which was won by the Liberal Democrat Dorothy Thornhill.
Elections to Watford Borough Council were held on 1 May 2003. One third of the council was up for election and the Liberal Democrats gained overall control of the council from no overall control. Overall turnout was 32.05%.
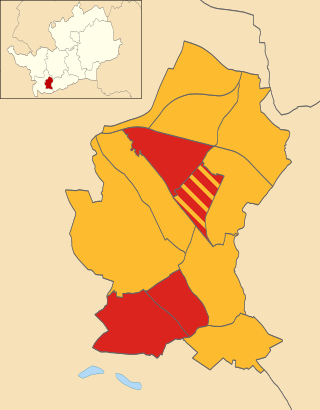
Elections to Watford Borough Council were held on 10 June 2004. One third of the council was up for election and the Liberal Democrat party kept overall control of the council. Overall turnout was 39.3%.
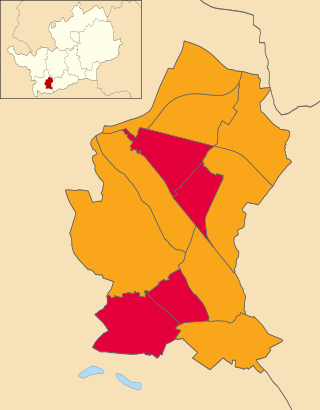
Elections to Watford Borough Council were held on 4 May 2006. One third of the council was up for election and the Liberal Democrat party kept overall control of the council. The Nascot Ward election was postponed to June 15 due to the death of the Labour candidate, Tom Meldrum. At the same time in the election for Watford's directly elected mayor the Liberal Democrat Dorothy Thornhill was re-elected.
Elections to Watford Borough Council were held on 3 May 2007. One third of the council was up for election and the Liberal Democrat party kept overall control of the council.
Elections to Watford Council were held on 1 May 2008. One third of the council was up for election and the Liberal Democrat party stayed in overall control of the council.
Elections to Watford Borough Council were held on 6 May 2010. Three years in every four, a third of the council retires and elections are held. The council election was held on the same day as the national General Election, when the Labour Party government lost power and the Watford parliamentary constituency was won by the Conservative Party.
The 2016 Watford Borough Council election took place on 5 May 2016 to elect members of Watford Borough Council in England. This was on the same day as other nationwide local elections. The entire council was up for election, with each of the 12 wards electing 3 councillors.
The 2018 Watford Borough Council election took place on 3 May 2018 to elect members of Watford Borough Council in England. This was the same day as other local elections.
The 2019 Watford Borough Council election took place on 2 May 2019 to elect members of Watford Borough Council in England. This was the same day as other local elections.
The 2021 Watford Borough Council election took place on 6 May 2021 to elect members of Watford Borough Council in England. This was the same day as other local elections.
The 1991 Watford Borough Council election took place in 1991 to elect members of Watford Borough Council in England. This was the same day as other local elections.
The 1992 Watford Borough Council election took place in 1992 to elect members of Watford Borough Council in England. This was the same day as other local elections.
The 1994 Watford Borough Council election took place in 1994 to elect members of Watford Borough Council in England. This was the same day as other local elections.
The 1995 Watford Borough Council election took place in 1995 to elect members of Watford Borough Council in England. This was the same day as other local elections.
The 1996 Watford Borough Council election took place in 1996 to elect members of Watford Borough Council in England. This was the same day as other local elections.
The 2022 Watford Borough Council election took place on 5 May 2022. One third (12) of the 36 members of Watford Borough Council were elected. The elections took place alongside elections to local authorities across the United Kingdom, and an election for the Mayor of Watford.