Related Research Articles
One third of Harrogate Borough Council in North Yorkshire, England was elected each year, followed by one year without election. Since the last boundary changes in 2002, 54 councillors had been elected from 35 wards. The last elections were held in 2018, ahead of the abolition of Harrogate Borough Council on 31 March 2023. Its functions transferred to the new North Yorkshire Council. The first elections to the North Yorkshire Council took place on 5 May 2022, when 21 councillors were elected from 21 divisions in the Borough of Harrogate.
The 1999 Worthing Borough Council election took place on 6 May 1999 to elect members of Worthing Borough Council in West Sussex, England. One third of the council was up for election and the Conservative Party gained overall control of the council from the Liberal Democrats. Overall turnout was 34.8%.
The 1999 Cheltenham Council election took place on 6 May 1999 to elect members of Cheltenham Borough Council in Gloucestershire, England. One third of the council was up for election and the Liberal Democrats lost overall control of the council to no overall control.
The 1999 Swindon Borough Council election took place on 6 May 1999 to elect members of Swindon Unitary Council in Wiltshire, England. One third of the council was up for election and the Labour party stayed in overall control of the council.
The 1999 Fareham Council election took place on 6 May 1999 to elect members of Fareham Borough Council in Hampshire, England. One third of the council was up for election and the Conservative party gained overall control of the council from no overall control.

The 1999 Solihull Metropolitan Borough Council election took place on 6 May 1999 to elect members of Solihull Metropolitan Borough Council in the West Midlands, England. One third of the council was up for election and the council stayed under no overall control.
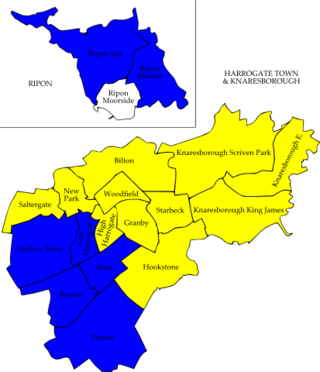
The 1998 Harrogate Council election took place on 7 May 1998 to elect members of Harrogate Borough Council in North Yorkshire, England. One third of the council was up for election and the Liberal Democrats stayed in overall control of the council.
The 2002 Harrogate Council election took place on 2 May 2002 to elect members of Harrogate Borough Council in North Yorkshire, England. The whole council was up for election with boundary changes since the last election in 2000 reducing the number of seats by 5. The Liberal Democrats lost overall control of the council to no overall control.
The 2003 Harrogate Council election took place on 1 May 2003 to elect members of Harrogate Borough Council in North Yorkshire, England. One third of the council was up for election and the council stayed under no overall control.
The 2004 Harrogate Council election took place on 10 June 2004 to elect members of Harrogate Borough Council in North Yorkshire, England. One third of the council was up for election and the Conservative Party stayed in overall control of the council.

The 2006 Harrogate Council election took place on 4 May 2006 to elect members of Harrogate Borough Council in North Yorkshire, England. One third of the council was up for election and the Conservative party lost overall control of the council to no overall control.
The 2007 Harrogate Council election took place on 3 May 2007 to elect members of Harrogate Borough Council in North Yorkshire, England. One third of the council was up for election and the council stayed under no overall control.

The 2008 Harrogate Council election took place on 1 May 2008 to elect members of Harrogate Borough Council in North Yorkshire, England. One third of the council was up for election and the council stayed under no overall control.
The 2010 Harrogate Council election took place on 6 May 2010 to elect members of Harrogate Borough Council in North Yorkshire, England. One third of the council was up for election and the Conservative party gained overall control of the council from no overall control.
The 1999 Pendle Borough Council election took place on 6 May 1999 to elect members of Pendle Borough Council in Lancashire, England. One third of the council was up for election and the Liberal Democrats lost overall control of the council to no overall control.

The 2004 Pendle Borough Council election took place on 10 June 2004 to elect members of Pendle Borough Council in Lancashire, England. One third of the council was up for election and the Liberal Democrats gained overall control of the council from no overall control.
The 1999 Sandwell Metropolitan Borough Council election took place on 6 May 1999 to elect members of Sandwell Metropolitan Borough Council in the West Midlands, England. One third of the council was up for election and the Labour party stayed in overall control of the council.
The 1999 Maidstone Borough Council election took place on 6 May 1999 to elect members of Maidstone Borough Council in Kent, England. One third of the council was up for election and the council stayed under no overall control.
The 1999 Walsall Metropolitan Borough Council election took place on 6 May 1999 to elect members of Walsall Metropolitan Borough Council in the West Midlands, England. One third of the council was up for election and the Labour party gained overall control of the council from no overall control.
The 1999 Crawley Borough Council election took place on 6 May 1999 to elect members of Crawley Borough Council in West Sussex, England. One third of the council was up for election and the Labour Party stayed in overall control of the council.
References
- ↑ "Harrogate". BBC News Online . Retrieved 12 January 2011.
- ↑ "How Britain voted: Council Election Results". The Independent from the Independent & the Independent on Sunday. The Independent. 8 May 1999. p. 12. ISSN 0951-9467.
- ↑ "Local Election Results, 1999". Centre for Research into Elections and Social Trends. Archived from the original on 24 July 2011. Retrieved 12 January 2011.
- 1 2 3 4 5 6 7 8 9 10 11 12 13 14 15 16 17 18 19 20 21 "District Council election" (PDF). Harrogate Borough Council. Retrieved 12 January 2011.[ permanent dead link ]
- ↑ "How the nations voted". The Times . 8 May 1999. p. 48. ISSN 0140-0460.