The eighth full elections for Guildford Borough Council took place on 6 May 1999. [1]
The Liberal Democrats had won control of the council in May 1995 with a majority of 1. However the first half of 1997 had seen the Liberal Democrats lose their majority as a result of three councillors (2 Stoughton councillors and 1 from Tongham) resigning from the party and a by election defeat in Merrow & Burpham ward. [2]
Going into the election there were 19 Liberal Democrats, 14 Conservatives, 6 Labour and 6 independents. These 6 independents formed three distinct groups. There were 3 councillors for Ash and Tongham wards (two of whom were former Liberal Democrat councillors, one having resigned from the party in the 1991-95 session and one during the 1995-1999 session) who classed themselves as the "Independent Group". Two former Liberal Democrat councillors representing Stoughton ward classed themselves as Liberals. The councillor for Tillingbourne classed himself as an independent councillor.
The May 1999 election saw 20 Liberal Democrats, 17 Conservatives, 6 Labour and 2 Independents elected. The council remained hung.
The Liberal Democrats gained 1 net seat (3 losses and 4 gains) on the position they held going into the election. The Liberal Democrats lost 3 seats to the west of the borough, 2 in Ash ward and 1 in Normandy. The Liberal Democrats retook the Merrow & Burpham seat which they had lost to the Conservatives in a by election in May 1997, plus they retook the 2 Stoughton seats which they had lost to resignations in February 1997. The Liberal Democrats also gained Effingham ward from the Conservatives.
The Conservatives made 3 net gains (2 losses and 5 gains) on the position which they held going into the election. The Conservatives lost the Merrow & Burpham seat which they had taken in the May 1997 by election. The Conservative also lost Effingham to the Liberal Democrats. The Conservatives gained 2 Ash Vale seats from the Independent Group, plus they gained from the Liberal Democrats 3 of the other seats in the west of the borough, 2 in Ash and 1 in Normandy.
The Independent Group did not contest its 2 seats in Ash Vale. These were gained by the Conservatives. The one member of the Independent Group who did contest his seat held on to it in Tongham. Neither councillor belonging to the Liberal Group sought reelection in Stoughton and the Liberal Democrats regained these two seats.
Relative to 1995, the changes were not as dramatic as they were relative to the position going into the election. Overall there was a shift to the Conservatives in the Ash and Normandy region to the west of the borough, but much less change between the parties elsewhere in the borough. The Liberal Democrats lost all their remaining seats in the Ash, Tongham and Normandy region, having won all 7 of the seats there as recently as 1991. After the election the Ash, Tongham and Normandy area had 1 independent and 6 Conservative councillors. Elsewhere in the borough the only seat to change hands relative to 1995 was Effingham, where a Conservative marginal, was captured by the Liberal Democrats.
Party | Candidate | Votes | % | ±% | |
---|---|---|---|---|---|
Conservative | John Ades | 1325 | |||
Conservative | John Cassar | 1100 | |||
Conservative | Nick Sutcliffe | 1009 | |||
Liberal Democrats | Alan Hilliar | 901 | |||
Liberal Democrats | Christine Frampton | 790 | |||
Liberal Democrats | Peter Morgan | 725 | |||
Labour | Kevin Jenkinson | 267 | |||
Labour | Kazimierz Jaskinski | 237 | |||
Labour | Donald Hirsch | 212 | |||
Majority | 108 | ||||
Turnout | 30.47 | ||||
Conservative hold | Swing | ||||
Conservative gain from Liberal Democrats | Swing | ||||
Party | Candidate | Votes | % | ±% | |
---|---|---|---|---|---|
Conservative | Chris Lawson | 752 | |||
Conservative | Marsha Moseley | 729 | |||
Liberal Democrats | Denise Smith | 665 | |||
Liberal Democrats | Geraldine Pettitt | 624 | |||
Labour | Alex MacDonald | 124 | |||
Labour | Brian Stace | 113 | |||
Majority | 64 | ||||
Turnout | 32 | ||||
Conservative gain from Independent | Swing | ||||
Party | Candidate | Votes | % | ±% | |
---|---|---|---|---|---|
Conservative | Andrew Hodges | 1102 | |||
Liberal Democrats | Vivienne Johnson | 945 | |||
Conservative | David Hunter | 912 | |||
Liberal Democrats | Tom Sharp | 792 | |||
Labour | Vijay Luthra | 126 | |||
Labour | Carole Barber | 119 | |||
Majority | 33 | ||||
Turnout | 52.56 | ||||
Conservative hold | Swing | ||||
Liberal Democrats hold | Swing | ||||
Party | Candidate | Votes | % | ±% | |
---|---|---|---|---|---|
Conservative | Jennifer Powell | 1705 [3] | |||
Conservative | Andrew French | 1604 | |||
Conservative | Jennifer Wicks | 1568 | |||
Liberal Democrats | Margaret Burnham | 404 | |||
Liberal Democrats | Clive Wicks | 384 | |||
Liberal Democrats | Philip Palmer | 340 | |||
Labour | Meriel Beynon | 305 | |||
Labour | Carolyn Fiddes | 274 | |||
Labour | Julie Roxburgh | 253 | |||
Majority | 1164 | ||||
Turnout | 36.49 | ||||
Conservative hold | Swing | ||||
Party | Candidate | Votes | % | ±% | |
---|---|---|---|---|---|
Liberal Democrats | Elizabeth Hogger | 573 | |||
Conservative | Valerie Chapman | 459 | |||
Labour | Carol Hayton | 25 | |||
Majority | 114 | ||||
Turnout | 53.47 | ||||
Liberal Democrats gain from Conservative | Swing | ||||
Party | Candidate | Votes | % | ±% | |
---|---|---|---|---|---|
Liberal Democrats | Richard Marks | 1226 | |||
Liberal Democrats | Robert Blundell | 1224 | |||
Liberal Democrats | David Goodwin | 1152 | |||
Conservative | Mark Hoban | 454 | |||
Conservative | Philip Hooper | 449 | |||
Conservative | John Fairley | 442 | |||
Labour | Tristan Brown | 320 | |||
Labour | Helen Ayscough | 302 | |||
Labour | Alexander Ayscough | 278 | |||
Majority | 698 | ||||
Turnout | 31.60 | ||||
Liberal Democrats hold | Swing | ||||
Party | Candidate | Votes | % | ±% | |
---|---|---|---|---|---|
Liberal Democrats | Tamsy Baker | 842 | |||
Liberal Democrats | Gordon Bridger | 792 | |||
Conservative | Sarah Creedy | 758 | |||
Conservative | Peter Le Cheminant | 710 | |||
Labour | Racheal Chesterton | 106 | |||
Labour | Barry Hall | 105 | |||
Majority | 34 | ||||
Turnout | 36.9 | ||||
Liberal Democrats hold | Swing | ||||
Party | Candidate | Votes | % | ±% | |
---|---|---|---|---|---|
Conservative | Margaret Fenston | 558 | |||
Labour | David Hide | 146 | |||
Liberal Democrats | John Telfer | 104 | |||
Majority | 412 | ||||
Turnout | 44.06 | ||||
Conservative hold | Swing | ||||
Party | Candidate | Votes | % | ±% | |
---|---|---|---|---|---|
Liberal Democrats | Charles Shepperd | 2134 | |||
Liberal Democrats | Andrew Allan | 2050 | |||
Liberal Democrats | Anne Lee | 1960 | |||
Conservative | Jennifer Jordan | 1628 | |||
Conservative | Nicholas Brougham | 1600 | |||
Conservative | Sheridan Westlake | 1576 | |||
Labour | Malcolm Hill | 413 | |||
Labour | William Scott | 367 | |||
Labour | Mary Wu | 359 | |||
Majority | 332 | ||||
Turnout | 41.52 | ||||
Liberal Democrats hold | Swing | ||||
Liberal Democrats gain from Conservative | Swing | ||||
Party | Candidate | Votes | % | ±% | |
---|---|---|---|---|---|
Conservative | Diana Lockyer-Nibbs | 498 | |||
Liberal Democrats | Robert Rendell | 454 | |||
Labour | Peter Newmark | 61 | |||
Majority | 44 | ||||
Turnout | 43.09 | ||||
Conservative gain from Liberal Democrats | Swing | ||||
Party | Candidate | Votes | % | ±% | |
---|---|---|---|---|---|
Liberal Democrats | Lynda Strudwick | 1046 | |||
Liberal Democrats | Tony Phillips | 1003 | |||
Liberal Democrats | Steven Freeman | 895 | |||
Conservative | Bernard Parke | 847 | |||
Conservative | Adrian Chandler | 746 | |||
Conservative | Simon Anglim | 705 | |||
Labour | Florence Flynn | 382 | |||
Labour | Carmel Rogers | 358 | |||
Labour | Raymond Rogers | 346 | |||
Majority | 48 | ||||
Turnout | 33.3 | ||||
Liberal Democrats hold | Swing | ||||
Party | Candidate | Votes | % | ±% | |
---|---|---|---|---|---|
Conservative | Robert Rolfe | 700 | |||
Conservative | Alan Dewhurst | 671 | |||
Liberal Democrats | Marliyn Merryweather | 234 | |||
Liberal Democrats | Peter Dyer | 222 | |||
Labour | Elizabeth Bullock | 115 | |||
Labour | Kathleen Parfitt | 100 | |||
Majority | 437 | ||||
Turnout | 34.93 | ||||
Conservative hold | Swing | ||||
Party | Candidate | Votes | % | ±% | |
---|---|---|---|---|---|
Conservative | Michael Nevins | 440 | |||
Liberal Democrats | May Laker | 285 | |||
Labour | Caroline Lloyd | 30 | |||
Majority | 155 | ||||
Turnout | 41.96 | ||||
Conservative hold | Swing | ||||
Party | Candidate | Votes | % | ±% | |
---|---|---|---|---|---|
Conservative | Keith Taylor | 694 | |||
Conservative | Jason Dobson | 611 | |||
Liberal Democrats | Dee Appardurai | 349 | |||
Liberal Democrats | Rupert Sheard | 334 | |||
Labour | Benedict Marlow | 142 | |||
Labour | Shelia Bean | 141 | |||
Majority | 262 | ||||
Turnout | 38.23 | ||||
Conservative hold | Swing | ||||
Party | Candidate | Votes | % | ±% | |
---|---|---|---|---|---|
Conservative | Vasilis Kapsalis | 634 | |||
Liberal Democrats | David Thomson | 501 | |||
Labour | Michael Jeram | 169 | |||
Majority | 133 | ||||
Turnout | 43.52 | ||||
Conservative hold | Swing | ||||
Party | Candidate | Votes | % | ±% | |
---|---|---|---|---|---|
Labour | Sallie Thornberry | 1091 | |||
Labour | Keith Chesterton | 1057 | |||
Labour | Angela Gunning | 1015 | |||
Liberal Democrats | Alan Lawrence | 297 | |||
Liberal Democrats | Stephen Wright | 294 | |||
Liberal Democrats | William Plaskett | 267 | |||
Conservative | Michael Dale | 258 | |||
Conservative | David Quelch | 239 | |||
Conservative | Paul Newman | 235 | |||
Majority | 718 | ||||
Turnout | 30.56 | ||||
Labour hold | Swing | ||||
Party | Candidate | Votes | % | ±% | |
---|---|---|---|---|---|
Liberal Democrats | Pauline Searle | 973 | |||
Liberal Democrats | Jayne Marks | 965 | |||
Liberal Democrats | Fiona White | 846 | |||
Labour | Gary Hills | 540 | |||
Labour | Stella Payne | 445 | |||
Labour | Susan Pickering | 439 | |||
Conservative | Roger Majoribanks | 358 | |||
Conservative | Paul Johnson | 355 | |||
Conservative | Caroline Newman | 338 | |||
Majority | 306 | ||||
Turnout | 27.3 | ||||
Liberal Democrats hold | Swing | ||||
Liberal Democrats gain from Independent | Swing | ||||
Party | Candidate | Votes | % | ±% | |
---|---|---|---|---|---|
Independent | Keith Childs | 1144 | |||
Liberal Democrats | Patricia Gumbrell | 904 | |||
Conservative | John Foster | 848 | |||
Labour | Edward Williams | 169 | |||
Labour | James Farrell | 86 | |||
Majority | 56 | ||||
Turnout | 45.48 | ||||
Independent hold | Swing | ||||
Liberal Democrats hold | Swing | ||||
Party | Candidate | Votes | % | ±% | |
---|---|---|---|---|---|
Tongham Independent | Michael Pooley | 208 | |||
Conservative | George Grundy | 182 | |||
Liberal Democrats | Patricia Hughes | 123 | |||
Labour | Frank Gunning | 62 | |||
Majority | 26 | ||||
Turnout | 33.21 | ||||
Independent hold | Swing | ||||
Party | Candidate | Votes | % | ±% | |
---|---|---|---|---|---|
Labour | John Woodhatch | 954 | |||
Labour | Peter Jennings | 826 | |||
Labour | Joan O'Byrne | 822 | |||
Liberal Democrats | Kenneth Briggs | 367 | |||
Liberal Democrats | Andrew Bevan | 328 | |||
Liberal Democrats | Joanna Hazelwood | 323 | |||
Conservative | Mary Johns | 216 | |||
Conservative | Barbara Dale | 213 | |||
Conservative | Pamela Parke | 208 | |||
Majority | 455 | ||||
Turnout | 25.46 | ||||
Labour hold | Swing | ||||
Party | Candidate | Votes | % | ±% | |
---|---|---|---|---|---|
Liberal Democrats | Terry King | 1256 | |||
Liberal Democrats | Auriol Earle | 1207 | |||
Liberal Democrats | Nigel Sutcliffe | 1192 | |||
Conservative | Ken Johns | 739 | |||
Conservative | Jonny Scriven | 713 | |||
Conservative | Bev Thomas | 674 | |||
Farmer Bob, Burpham Court Farm Conservationist | Bob Dearnley | 379 | |||
Labour | Alan Ritchie | 224 | |||
Labour | Ron Medlow | 189 | |||
Labour | Saiful Islam | 158 | |||
Majority | 453 | ||||
Turnout | 38.2 | ||||
Liberal Democrats hold | Swing | ||||
The Borough of Guildford is a local government district with borough status in Surrey, England. With around half of the borough's population, Guildford is its largest settlement and only town, and is where the council is based.
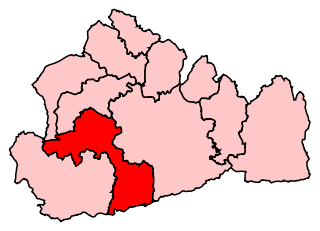
Guildford is a constituency in Surrey represented in the House of Commons of the UK Parliament since 2019 by Angela Richardson, a Conservative.
Surrey Heath is a constituency represented in the House of Commons of the UK Parliament since 2005 by Michael Gove, a Conservative who has also been the Secretary of State for Levelling Up, Housing and Communities since October 2022. The Home counties suburban constituency is in the London commuter belt, on the outskirts of Greater London. Surrey Heath is in the north west of Surrey and borders the counties of Berkshire and Hampshire.
Guildford Borough Council in Surrey, England is elected every four years.
The 2007 council elections in Guildford saw the Conservatives retain control over Guildford Borough Council. Full results for each ward can be found at Guildford Council election, full results, 2007.
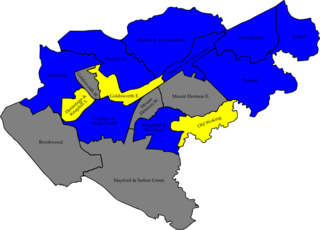
The 2007 Woking Council election took place on 3 May 2007 to elect members of Woking Borough Council in Surrey, England. One third of the council was up for election and the Conservative Party gained overall control of the council from no overall control.
The 2010 Woking Council election took place on 6 May 2010, on the same day as the 2010 general election, to elect members of Woking Borough Council in Surrey, England. One third of the council was up for election and the council stayed under no overall control.
The first ever Guildford Borough Council full-council elections were held on 7 June 1973. The Conservatives won control of the council with a majority of 16, winning 29 of the 42 seats.
The second Guildford Borough Council full-council elections were held on 6 May 1976. The Conservatives retained control of the council with an increased majority, winning 35 of the 45 seats.
The third Guildford Borough Council full-council elections were held on 3 May 1979, the same day as the General Election. The Conservatives retained control over the council winning 34 of the 45 seats. This represented a net loss of one seat from the 1976 elections. Labour retained all 6 councillors in its two strongholds Stoke and Westborough. The Liberals won 3 seats, a net gain of one seat from the 1976 elections. The Independents won 2 seats.
The fifth full elections for Guildford Borough Council took place on 1 May 1987. The Conservatives retained control of the council winning 30 of the 45 seats on the council. This represented one net loss for the Conservatives, relative to the 1983 council elections. Labour retained its 6 councillors. The SDP-Liberal Alliance won 9 seats, a net gain of two seats on the 1983 council elections. No independents were elected to the council, one had been elected in 1983.
The seventh full elections for Guildford Borough Council took place on 4 May 1995. The results saw the Liberal Democrats win majority control of the council for the first time winning 23 of the 45 seats. The Conservatives won 13 seats. Labour retained 6 seats and 3 independents were elected.
The sixth full elections for Guildford Borough Council took place on 2 May 1991. The Conservatives lost control of Guildford Borough Council for the first time since the council was created in the early 1970s. Overall the election resulted in a hung council with 19 Conservative councillors, 19 Liberal Democrats, 6 Labour and 1 independent.
The 2011 council elections in Guildford saw the Conservatives retain control over Guildford Borough Council with an increased majority of 20 seats. Full results for each ward can be found at Guildford Council election, full results, 2011.
The 2003 elections for Guildford Borough Council were the first, and as of 2011 the only, full election for Guildford Borough Council conducted by an all postal ballot. The result saw the Conservatives win a majority of seats on Guildford Borough Council for the first time since losing their majority in the 1991 election.
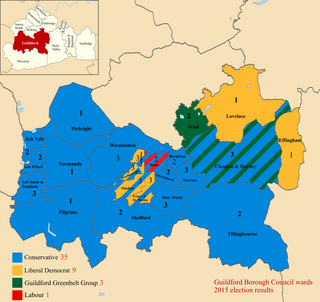
The 2015 Guildford Borough Council election took place on 7 May 2015 to elect members of Guildford Borough Council in England as one of the 2015 local elections, held simultaneously with the General Election.
The 2019 Guildford Borough Council election were held on 2 May 2019, to elect all 48 seats to the Guildford Borough Council in Surrey, England as part of the 2019 local elections.
The 2023 Guildford Borough Council election was held on 4 May 2023, to elect all 48 seats to the Guildford Borough Council in Surrey, England as part of the 2023 local elections. The results saw the Liberal Democrat take overall control of Guildford Borough Council.