1999 St Albans City and District Council election

Last updated

Map of the results of the 1999 St Albans City and District Council election. Liberal Democrats in yellow, Conservatives in blue and Labour in red. St Albans UK local election 1999 map.svg
Map of the results of the 1999 St Albans City and District Council election. Liberal Democrats in yellow, Conservatives in blue and Labour in red.

The 1999 St Albans City and District Council election took place on 6 May 1999 to elect members of St Albans City and District Council in Hertfordshire, England. The whole council was up for election with boundary changes since the last election in 1998 increasing the number of seats by 1. [1] The Liberal Democrats lost overall control of the council to no overall control. [2]

Contents

Election result

Both the Liberal Democrats and Conservatives won 21 seats, while Labour took 16 seats. [3] Boundary changes had increased the number of seats to 58 from 57, with an exact seat in Sandridge ward. [3] The closest result was in Harpenden East, where Conservative Michael Clark won a seat by 3 votes defeating the mayor Brian Peyton. [3] Overall turnout at the election was 37.1%, up from 35.3% at the 1998 election but down from the 39.6% in 1996. [3]

St Albans local election result 1999 [4] [5]
PartySeatsGainsLossesNet gain/lossSeats %Votes %Votes+/−
  Liberal Democrats 21-936.234.836,609-1.1%
  Conservative 21+1036.234.536,217+1.2%
  Labour 16027.630.532,101-0.3%
  Independent 0000.2178+0.2%

Ward results

Ashley (3 seats) [5]
PartyCandidateVotes%±%
Labour Alistair Cooper 1,007 58.8
Labour Malachy Pakenham 946 55.2
Labour Edward Hill 944 55.1
Liberal Democrats Francesca Day44425.9
Liberal Democrats Dawn Devereux44225.8
Liberal Democrats David Parry37822.1
Conservative James Black31918.6
Conservative Peter White28716.7
Conservative Philip Oxley28416.6
Turnout 1,71434.7
Batchwood (3 seats) [5]
PartyCandidateVotes%±%
Labour David McManus 1,063 65.4
Labour Roma Mills 1,045 64.3
Labour Andrew Rose 990 60.9
Liberal Democrats Richard Biddle28317.4
Conservative Edward Ellis26916.5
Conservative Pamela Farley26516.3
Liberal Democrats Robin Law25715.8
Conservative Margaret Winterhoff25015.4
Liberal Democrats Robert Latham24214.9
Turnout 1,62632.8
Clarence (3 seats) [5]
PartyCandidateVotes%±%
Liberal Democrats Sheila Burton 1,089 53.5
Liberal Democrats Joyce Lusby 1,018 50.0
Liberal Democrats John Wright 1,006 49.4
Labour Nigel Culkin61930.4
Labour Helen Hutchinson60529.7
Labour Clive Newport58128.5
Conservative Jeremy Christie35617.5
Conservative Nigel Woodsmith35017.2
Conservative James Vessey34016.7
Turnout 2,037
Colney Heath (2 seats) [5]
PartyCandidateVotes%±%
Liberal Democrats Susan Defoe 532 47.6
Liberal Democrats John Henchley 531 47.5
Conservative Julia Jeffrey28825.8
Labour Gordon Watson28825.8
Conservative Derek Jeffrey28225.2
Labour Michael Gibson26824.0
Turnout 1,11733.7
Cunningham (3 seats) [5]
PartyCandidateVotes%±%
Liberal Democrats Robert Donald 1,007 47.1
Liberal Democrats Edward Roberts 882 41.2
Labour Andrew Gilson 877 41.0
Liberal Democrats Geoffrey Harrison84839.6
Labour Laurence Heyman84639.6
Labour David Allan83939.2
Conservative Diana Hall35416.5
Conservative Graham Leonard32315.1
Conservative Louisa-Jane Rosalki29914.0
Turnout 2,13945.0
Harpenden East (3 seats) [5]
PartyCandidateVotes%±%
Liberal Democrats David Waddilove 862 41.8
Liberal Democrats Alison Steer 834 40.4
Conservative Michael Clark 799 38.7
Liberal Democrats Brian Peyton79638.6
Conservative John Cozens74135.9
Conservative Victor Holley73535.6
Labour David Crew47022.8
Labour Rosemary Ross41720.2
Labour Elizabeth McShane39819.3
Turnout 2,06238.1
Harpenden North (3 seats) [5]
PartyCandidateVotes%±%
Conservative Albert Pawle 820 45.1
Liberal Democrats John Coad 814 44.8
Conservative David Coe 787 43.3
Conservative Maurice Purkiss77642.7
Liberal Democrats Terence Glenister72640.0
Liberal Democrats Valerie Goodyear70238.6
Labour David Dunmore23613.0
Labour Gavin Ross23512.9
Labour Richard Botterill23212.8
Turnout 1,81734.9
Harpenden South (3 seats) [5]
PartyCandidateVotes%±%
Conservative Paul Foster 1,113 58.5
Conservative Patrick Johnston 1,093 57.4
Conservative Michael Morrell 1,081 56.8
Liberal Democrats Katharine Sutton45623.9
Liberal Democrats Christopher Canfield44123.2
Liberal Democrats Paul De Kort38920.4
Labour Julie Lightfoot35318.5
Labour Enid Bright33417.5
Labour Melvin Cato32317.0
Turnout 1,90436.2
Harpenden West (3 seats) [5]
PartyCandidateVotes%±%
Conservative Julian Daly 1,189 61.3
Conservative John Newman 1,170 60.3
Conservative Julian Turner 1,170 60.3
Liberal Democrats Mary Skinner43022.2
Liberal Democrats George Gostling41121.2
Liberal Democrats Paul Spinks41021.1
Labour Ruth Gordon-Weeks31616.3
Labour Elizabeth Rayner29515.2
Labour David Lawlor28814.8
Turnout 1,94034.0
London Colney (3 seats) [5]
PartyCandidateVotes%±%
Labour Malcolm MacMillan 1,064 68.4
Labour Etheldreda Gordon 1,047 67.3
Labour Sean Flynn 1,026 66.0
Conservative Avril Foster29318.8
Conservative Derek Caroline27717.8
Conservative Carol Howard27717.8
Liberal Democrats Sarah Piercy15910.2
Liberal Democrats David Priestman1499.6
Liberal Democrats Moira Seton1248.0
Turnout 1,55526.4
Marshalswick North (3 seats) [5]
PartyCandidateVotes%±%
Liberal Democrats Geoffrey Churchard 910 45.5
Liberal Democrats Thomas Clegg 826 41.3
Liberal Democrats Jennifer Stroud 803 40.1
Conservative Frances Leonard71635.8
Conservative John Foster69834.9
Conservative Michael Bretherton67633.8
Labour John Baughan39819.9
Labour Flora Falconer37818.9
Labour Lynda Harris37118.5
Turnout 2,00239.8
Marshalswick South (3 seats) [5]
PartyCandidateVotes%±%
Liberal Democrats Anthony Rowland 1,088 49.4
Liberal Democrats John Peters 946 42.9
Liberal Democrats Joy Winder 865 39.2
Conservative Brian Doble70031.8
Conservative Agnes Hill69731.6
Conservative Philip Webster68230.9
Labour Eleanor Harris51823.5
Labour Jane Cloke48622.1
Labour Janet Smith46321.0
Turnout 2,20442.2
Park Street (3 seats) [5]
PartyCandidateVotes%±%
Liberal Democrats Richard Downs 702 39.6
Liberal Democrats Barry Blackwell 671 37.8
Conservative Thomas Burns 668 37.7
Conservative Michael Pugh66037.2
Conservative Nigel Cocks65937.1
Liberal Democrats Syed Abidi64636.4
Labour Mary Morley41823.6
Labour David Davies37821.3
Labour Ronald Wilson35720.1
Turnout 1,77432.7
Redbourn (3 seats) [5]
PartyCandidateVotes%±%
Conservative Margaret Corley 851 44.3
Liberal Democrats Patricia Schofield 818 42.6
Conservative Brian Chapman 797 41.5
Conservative Paul Finigan69636.3
Liberal Democrats John Schofield67535.2
Liberal Democrats Eric Humbles63032.8
Labour Colin Hucklesby33617.5
Labour Vivienne Windle30515.9
Labour John Paton25313.2
Turnout 1,92041.4
Sandridge (2 seats) [5]
PartyCandidateVotes%±%
Conservative Christopher Whiteside 637 42.8
Liberal Democrats William Morris 564 37.9
Conservative Beric Read52935.6
Liberal Democrats Laurence Brown44930.2
Labour Christine Dawson26017.5
Labour John Tomblin24916.7
Independent Basil Filmer17812.0
Turnout 1,48839.7
Sopwell (3 seats) [5]
PartyCandidateVotes%±%
Labour Janetta Gibbs 1,043 68.0
Labour David Enright 1,034 67.4
Labour Mark Wilson 1,016 66.3
Conservative Eileen Brown28718.7
Conservative Janet Cameron27618.0
Conservative Margaret Brownlie27417.9
Liberal Democrats Peter Harris19212.5
Liberal Democrats John Hale17811.6
Liberal Democrats David Terrar15710.2
Turnout 1,53328.9
St Peters (3 seats) [5]
PartyCandidateVotes%±%
Labour Lynette Warren 973 54.8
Labour Winifred Dunleavy 955 53.8
Labour Helen Ives-Rose 912 51.4
Liberal Democrats John Gunner54430.7
Liberal Democrats Alisdair Gould52829.8
Liberal Democrats Michael Saunders49127.7
Conservative Geoffrey Brown27215.3
Conservative Sheila Sanders26414.9
Conservative Mark Shaw22712.8
Turnout 1,77434.4
St Stephen (3 seats) [5]
PartyCandidateVotes%±%
Conservative Gordon Myland 904 46.2
Conservative Susan Carr 836 42.7
Conservative Hazel Ward 826 42.2
Liberal Democrats Kahlil Moghul74037.8
Liberal Democrats Jadwiga Baillie70836.2
Liberal Democrats Gerald Kaye64733.1
Labour Patricia Allen31416.0
Labour Janet Blackwell30615.6
Labour Anthony Allen28214.4
Turnout 1,95738.2
Verulam (3 seats) [5]
PartyCandidateVotes%±%
Conservative John Smith 1,124 46.8
Conservative Richard Blossom 1,030 42.9
Conservative Clare Ellis 991 41.2
Liberal Democrats Martin Frearson93038.7
Liberal Democrats Kathleen Morris88536.8
Liberal Democrats Susan Campbell85935.7
Labour Karl Bruckdorfer43418.1
Labour Jilliam Butchart43218.0
Labour Constance Vuolo40616.9
Turnout 2,40345.8
Wheathampstead (3 seats) [5]
PartyCandidateVotes%±%
Liberal Democrats Christopher Oxley 964 45.5
Conservative Keith Stammers 963 45.4
Conservative Gillian Clark 888 41.9
Liberal Democrats Neil Page80437.9
Conservative Derek Hills80237.8
Liberal Democrats Paul Edelston72734.3
Labour Peter Woodhams31014.6
Labour Mary Cheale29413.9
Labour Michael Fletcher26812.6
Turnout 2,11944.5

By-elections between 1999 and 2000

Verulam by-election 2 December 1999 [6]
PartyCandidateVotes%±%
Conservative 911 47.0 +1.8
Liberal Democrats 85844.3+6.9
Labour 1688.7-8.7
Majority532.7
Turnout 1,93737.0-8.8
Conservative hold Swing

Related Research Articles

<span class="mw-page-title-main">Hertsmere (UK Parliament constituency)</span> Parliamentary constituency in the United Kingdom, 1983 onwards

Hertsmere is a constituency in Hertfordshire, England, represented in the House of Commons since 2015 by Oliver Dowden, who currently serves as deputy prime minister.

The 2000 Craven District Council election took place on 4 May 2000 to elect members of Craven District Council in North Yorkshire, England. One third of the council was up for election and the Conservative Party stayed in overall control of the council.

St Albans City and District Council elections are held three years out of every four to elect members of St Albans City and District Council in Hertfordshire, England. Since the last boundary changes in 2022 the council has comprised 56 councillors, with the district being divided into 20 wards. Elections to Hertfordshire County Council are held in the fourth year of the cycle when there are no district council elections.

<span class="mw-page-title-main">2008 St Albans City and District Council election</span>

The 2008 St Albans City and District Council election took place on 1 May 2008 to elect members of St Albans District Council in Hertfordshire, England. One third of the council was up for election and the Liberal Democrats gained overall control of the council from no overall control.

The 1998 St Albans City and District Council election took place on 7 May 1998 to elect members of St Albans City and District Council in Hertfordshire, England. One third of the council was up for election and the Liberal Democrats stayed in overall control of the council.

<span class="mw-page-title-main">2000 St Albans City and District Council election</span>

The 2000 St Albans City and District Council election took place on 4 May 2000 to elect members of St Albans District Council in Hertfordshire, England. One third of the council was up for election and the council stayed under no overall control.

<span class="mw-page-title-main">2002 St Albans City and District Council election</span>

The 2002 St Albans City and District Council election took place on 2 May 2002 to elect members of St Albans District Council in Hertfordshire, England. One third of the council was up for election and the council stayed under no overall control.

<span class="mw-page-title-main">2003 St Albans City and District Council election</span>

The 2003 St Albans City and District Council election took place on 1 May 2003 to elect members of St Albans District Council in Hertfordshire, England. One third of the council was up for election and the council stayed under no overall control.

<span class="mw-page-title-main">2004 St Albans City and District Council election</span>

The 2004 St Albans City and District Council election took place on 10 June 2004 to elect members of St Albans District Council in Hertfordshire, England. One third of the council was up for election and the council stayed under no overall control.

<span class="mw-page-title-main">2006 St Albans City and District Council election</span>

The 2006 St Albans City and District Council election took place on 4 May 2006 to elect members of St Albans District Council in Hertfordshire, England. One third of the council was up for election and the Liberal Democrats gained overall control of the council from no overall control.

<span class="mw-page-title-main">2007 St Albans City and District Council election</span> 2007 UK local government election

The 2007 St Albans City and District Council election took place on 3 May 2007 to elect members of St Albans District Council in Hertfordshire, England. One third of the council was up for election and the Liberal Democrats lost overall control of the council to no overall control.

The 1998 Wyre Forest District Council election took place on 7 May 1998 to elect members of Wyre Forest District Council in Worcestershire, England. One-third of the council was up for election and the Labour Party stayed in overall control of the council.

The 2004 Welwyn Hatfield District Council election took place on 10 June 2004 to elect members of Welwyn Hatfield District Council in Hertfordshire, England. One third of the council was up for election and the Conservative Party stayed in overall control of the council.

<span class="mw-page-title-main">2010 St Albans City and District Council election</span>

The 2010 St Albans City and District Council election took place on 6 May 2010 to elect members of St Albans District Council in Hertfordshire, England. One third of the council was up for election and the Liberal Democrats stayed in overall control of the council.

<span class="mw-page-title-main">2003 Derbyshire Dales District Council election</span>

The 2003 Derbyshire Dales District Council election took place on 1 May 2003 to elect members of Derbyshire Dales District Council in Derbyshire, England. The whole council was up for election with boundary changes since the last election in 1999. The Conservative Party stayed in overall control of the council.

<span class="mw-page-title-main">2011 St Albans City and District Council election</span> 2011 UK local government election

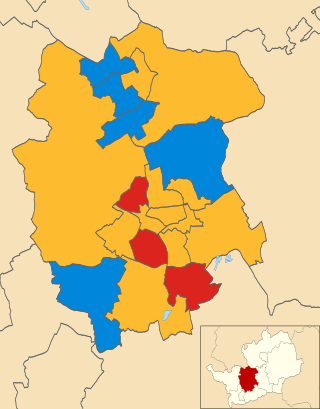
The 2011 St Albans City and District Council election took place on 5 May 2011 to elect members of St Albans District Council in Hertfordshire, England. One third of the council was up for election and the Liberal Democrats lost overall control of the council to no overall control.

<span class="mw-page-title-main">2014 St Albans City and District Council election</span> English local election

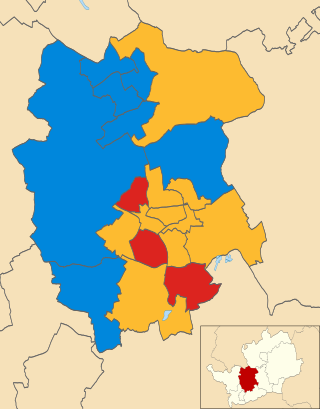
The 2014 St Albans City and District Council election took place on 22 May 2014 to elect members of St Albans District Council in Hertfordshire, England. One third of the council was up for election and the council stayed under no overall control.

The 1999 Rother District Council election took place on 6 May 1999 to elect members of Rother District Council in East Sussex, England. The whole council was up for election and the Conservative Party gained overall control of the council from no overall control.

<span class="mw-page-title-main">2003 West Berkshire Council election</span>

The 2003 West Berkshire Council election took place on 1 May 2003 to elect members of West Berkshire Council in Berkshire, England. The whole council was up for election with boundary changes since the last election in 2000 reducing the number of seats by two. The Liberal Democrats lost overall control of the council to no overall control.

<span class="mw-page-title-main">2007 West Berkshire Council election</span>

The 2007 West Berkshire Council election took place on 3 May 2007 to elect members of West Berkshire Council in Berkshire, England. The whole council was up for election and the Conservative Party stayed in overall control of the council.

References

  1. "St Albans". BBC News Online . Retrieved 7 January 2015.
  2. "How Britain voted: Council Election Results". The Independent . 8 May 1999. p. 12.
  3. 1 2 3 4 "Only a quarter of the electorate turned out to vote in one ward as the first all-out council election for 25 years failed to capture the public's imagination". Hertfordshire County Publications. NewsBank. 29 May 1999.
  4. "How the nations voted". The Times . 8 May 1999. p. 48.
  5. 1 2 3 4 5 6 7 8 9 10 11 12 13 14 15 16 17 18 19 20 21 "District Council Elections 6 May 1999 results". St Albans City and District Council. Archived from the original on 13 April 2001. Retrieved 7 January 2015.
  6. "Local Authority Byelection Results - December 1999". Local Authority Byelection Results. Archived from the original on 10 August 2014. Retrieved 8 January 2015.