1987 St Albans City and District Council election

Last updated

The 1987 St Albans City and District Council election took place on 7 May 1987 to elect members of St Albans City and District Council in England. [1] This was on the same day as other local elections.

Contents

Summary

1987 St Albans City and District Council election
PartyThis electionFull councilThis election
SeatsNetSeats %OtherTotalTotal %VotesVotes %+/−
  Conservative 12Increase2.svg 263.2132543.923,34744.8+7.3
  Alliance 5Decrease2.svg 126.3192442.120,71339.7+0.3
  Labour 2Decrease2.svg 110.55712.37,59114.6–4.6
  Independent 0Steady2.svg0.0111.81150.2–1.9
  Green 0Steady2.svg0.0000.03460.7+0.1

Ward results

Ashley

Ashley
PartyCandidateVotes%±%
Alliance S. Skipp 1,384 53.1 +4.6
Conservative S. Capper84232.3+2.0
Labour C. Leet37914.5–6.7
Majority54220.8+2.6
Turnout 2,60552.2+3.2
Registered electors 4,994
Alliance hold Swing Increase2.svg1.3

Batchwood

Batchwood
PartyCandidateVotes%±%
Labour P. Hiscott* 1,053 37.1 –1.0
Alliance N. Frosick98234.6–2.9
Conservative A. Wells-Baker71025.0+0.5
Green A. James953.3N/A
Majority712.5N/A
Turnout 2,84058.2+9.2
Registered electors 4,882
Labour hold Swing Increase2.svg1.0

Clarence

Clarence
PartyCandidateVotes%±%
Alliance J. Whale 1,180 43.6 –4.3
Conservative M. Hicks1,13942.1+6.3
Labour S. Seelig38714.3–2.0
Majority411.5–10.6
Turnout 2,70661.5+9.5
Registered electors 4,400
Alliance gain from Conservative Swing Decrease2.svg5.3

Cunningham

Cunningham
PartyCandidateVotes%±%
Alliance D. Hammerson 1,157 47.3 +0.4
Conservative C. Ellis91537.4+4.4
Labour T. Jones37515.3–4.8
Majority2429.9–4.1
Turnout 2,44751.2+4.2
Registered electors 4,777
Alliance hold Swing Decrease2.svg2.0

Harpenden East

Harpenden East
PartyCandidateVotes%±%
Conservative M. Morrell 1,610 50.6 +8.9
Alliance L. Johnstone1,29940.8–3.3
Labour D. Crew2758.6–1.2
Majority3119.8N/A
Turnout 3,18462.4+5.4
Registered electors 5,100
Conservative hold Swing Increase2.svg6.1

No Green candidate as previous (4.4%).

Harpenden North

Harpenden North
PartyCandidateVotes%±%
Conservative C. Curl* 1,721 54.3 +7.3
Alliance D. Wright1,19437.7+1.4
Labour B. Saffery2528.0–2.8
Majority52716.6+5.9
Turnout 3,16753.7+2.7
Registered electors 5,896
Conservative hold Swing Increase2.svg3.0

No Green candidate as previous (5.9%).

Harpenden South

Harpenden South
PartyCandidateVotes%±%
Conservative G. Beedie 1,718 62.7 +6.0
Alliance B. Webb85331.1–3.5
Labour J. Bailey1706.2–2.5
Majority86531.6+9.4
Turnout 2,74153.4+4.4
Registered electors 5,132
Conservative hold Swing Increase2.svg4.8

Harpenden West

Harpenden West
PartyCandidateVotes%±%
Conservative D. Coe 1,696 60.4 +5.6
Alliance D. Groom95834.1–2.7
Labour J. O'Brien1565.6–2.8
Majority73826.3+8.3
Turnout 2,81053.5+2.5
Registered electors 5,257
Conservative hold Swing Increase2.svg4.2

London Colney

London Colney
PartyCandidateVotes%±%
Conservative K. Hoplin 1,003 40.5 +11.9
Labour E. Gordon99640.2–1.7
Alliance T. Stainton47819.3N/A
Majority70.3N/A
Turnout 2,47744.4+1.4
Registered electors 5,573
Conservative gain from Labour Swing Increase2.svg6.8

No Independent Labour (22.8%) or Independent (6.6%) candidates as previous.

Marshallwick North

Marshallwick North
PartyCandidateVotes%±%
Conservative A. Hill 1,387 47.5 +6.9
Alliance B. Gibson1,30244.6–4.9
Labour J. McPheat2287.8–2.1
Majority852.9N/A
Turnout 2,91757.5+4.5
Registered electors 5,070
Conservative hold Swing Increase2.svg5.9

Marshallwick South

Marshallwick South
PartyCandidateVotes%±%
Conservative O. Jennings* 1,574 48.3 +4.1
Alliance S. Ward1,37742.2–2.2
Labour D. Allan3119.5–1.9
Majority1976.0N/A
Turnout 3,26262.4+6.4
Registered electors 5,225
Conservative hold Swing Increase2.svg3.2

Park Street

Park Street
PartyCandidateVotes%±%
Alliance M. Cummins* 999 48.4 –3.5
Conservative B. McArdie86341.9+9.6
Labour P. Robinson2009.7–6.1
Majority1366.6–13.1
Turnout 2,06247.4+5.4
Registered electors 4,350
Alliance hold Swing Decrease2.svg6.6

Redbourn

Redbourn
PartyCandidateVotes%±%
Conservative B. Chapman 1,270 50.3 +3.4
Alliance P. Schofield97038.4+5.0
Labour G. Harris28611.3–8.4
Majority30011.9–1.6
Turnout 2,52656.1+5.1
Registered electors 4,501
Conservative hold Swing Decrease2.svg0.8

Sandridge

Sandridge
PartyCandidateVotes%±%
Conservative C. Whiteside 991 53.3 +19.9
Alliance C. Oxley59031.7N/A
Independent C. Bracey1156.2N/A
Labour E. Adams1085.8–1.5
Green E. Field563.0N/A
Majority40121.6N/A
Turnout 1,86051.4–2.9
Registered electors 3,622
Conservative gain from Independent Swing N/A

No Independent candidate as previous (59.4%).

Sopwell

Sopwell
PartyCandidateVotes%±%
Labour J. Gipps 1,041 40.1 –8.0
Alliance M. Saunders99038.2+7.9
Conservative T. Wakerley48318.6–3.1
Green D. Southgate793.0N/A
Majority512.0–15.8
Turnout 2,59354.0+3.0
Registered electors 4,802
Labour hold Swing Decrease2.svg8.0

St. Peters

St. Peters
PartyCandidateVotes%±%
Alliance J. Gunner 1,136 45.4 –1.0
Conservative T. Deamer73629.4+4.9
Labour G. Powell62825.1–4.1
Majority40016.0–1.2
Turnout 2,50055.2+5.2
Registered electors 4,528
Alliance hold Swing Decrease2.svg3.0

St. Stephens

St. Stephens
PartyCandidateVotes%±%
Conservative A. Nowell* 1,632 49.3 +14.2
Alliance M. Moore1,34740.7+14.6
Labour M. Morcom33410.1–0.8
Majority2858.6+1.4
Turnout 3,31357.9+3.9
Registered electors 5,717
Conservative hold Swing Decrease2.svg0.2

No Independent candidate as previous (27.9%).

Verulam

Verulam
PartyCandidateVotes%±%
Conservative K. Davies* 1,757 54.1 +5.0
Alliance C. White1,28239.5+0.8
Labour J. Bellchambers2086.4–4.4
Majority47514.6+4.2
Turnout 3,24762.1+7.1
Registered electors 5,226
Conservative hold Swing Increase2.svg2.1

No Independent candidate as previous (1.3%).

Wheathampstead

Wheathampstead
PartyCandidateVotes%±%
Conservative F. Summerlin 1,300 45.5 +5.2
Alliance I. Gledhill1,23543.3–8.7
Labour K. Spooner2047.1–0.6
Green J. Bishop1164.1N/A
Majority652.3N/A
Turnout 2,85558.6+4.6
Registered electors 4,869
Conservative hold Swing Increase2.svg7.0

Related Research Articles

<span class="mw-page-title-main">St Albans City and District</span> Local authority district in England

The City and District of St Albans is a local government district with city status in Hertfordshire, England. Its council is based in St Albans, the largest settlement in the district. The district also includes the town of Harpenden and several villages. The district borders North Hertfordshire, Welwyn Hatfield, Hertsmere, Watford, Three Rivers, Dacorum, and Central Bedfordshire.

<span class="mw-page-title-main">Hitchin and Harpenden (UK Parliament constituency)</span> Parliamentary constituency in the United Kingdom, 1997 onwards

Hitchin and Harpenden is a constituency represented in the House of Commons of the UK Parliament since 2017 by Bim Afolami, a Conservative.

<span class="mw-page-title-main">2008 St Albans City and District Council election</span>

The 2008 St Albans City and District Council election took place on 1 May 2008 to elect members of St Albans District Council in Hertfordshire, England. One third of the council was up for election and the Liberal Democrats gained overall control of the council from no overall control.

<span class="mw-page-title-main">2002 St Albans City and District Council election</span>

The 2002 St Albans City and District Council election took place on 2 May 2002 to elect members of St Albans District Council in Hertfordshire, England. One third of the council was up for election and the council stayed under no overall control.

<span class="mw-page-title-main">2003 St Albans City and District Council election</span>

The 2003 St Albans City and District Council election took place on 1 May 2003 to elect members of St Albans District Council in Hertfordshire, England. One third of the council was up for election and the council stayed under no overall control.

<span class="mw-page-title-main">2004 St Albans City and District Council election</span>

The 2004 St Albans City and District Council election took place on 10 June 2004 to elect members of St Albans District Council in Hertfordshire, England. One third of the council was up for election and the council stayed under no overall control.

<span class="mw-page-title-main">2006 St Albans City and District Council election</span>

The 2006 St Albans City and District Council election took place on 4 May 2006 to elect members of St Albans District Council in Hertfordshire, England. One third of the council was up for election and the Liberal Democrats gained overall control of the council from no overall control.

<span class="mw-page-title-main">2007 St Albans City and District Council election</span>

The 2007 St Albans City and District Council election took place on 3 May 2007 to elect members of St Albans District Council in Hertfordshire, England. One third of the council was up for election and the Liberal Democrats lost overall control of the council to no overall control.

St Albans was a parliamentary electorate in Christchurch, New Zealand from 1881 to 1890, then from 1946 to 1996.

<span class="mw-page-title-main">2010 St Albans City and District Council election</span>

The 2010 St Albans City and District Council election took place on 6 May 2010 to elect members of St Albans District Council in Hertfordshire, England. One third of the council was up for election and the Liberal Democrats stayed in overall control of the council.

<span class="mw-page-title-main">2012 St Albans City and District Council election</span>

The 2012 St Albans City and District Council election took place on 3 May 2012 to elect members of St Albans District Council in Hertfordshire, England. One third of the council was up for election and the council stayed under no overall control.

<span class="mw-page-title-main">2011 St Albans City and District Council election</span>

The 2011 St Albans City and District Council election took place on 5 May 2011 to elect members of St Albans District Council in Hertfordshire, England. One third of the council was up for election and the Liberal Democrats lost overall control of the council to no overall control.

<span class="mw-page-title-main">2014 St Albans City and District Council election</span>

The 2014 St Albans City and District Council election took place on 22 May 2014 to elect members of St Albans District Council in Hertfordshire, England. One third of the council was up for election and the council stayed under no overall control.

<span class="mw-page-title-main">2019 St Albans City and District Council election</span> Election

The 2019 St Albans City and District Council election took place on 2 May 2019 to elect members of St Albans City and District Council in England. This was on the same day as other local elections. At the elections, the Conservatives lost control of the council

<span class="mw-page-title-main">2021 Hertfordshire County Council election</span>

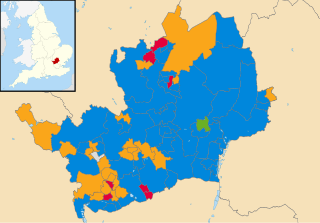
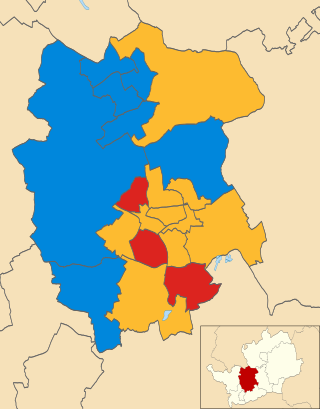
Elections to Hertfordshire County Council took place on 6 May 2021 alongside other local elections in the United Kingdom. All 78 seats to the council were elected.

The 1991 St Albans City and District Council election took place on 2 May 1991 to elect members of St Albans City and District Council in England. This was on the same day as other local elections.

The 1992 St Albans City and District Council election took place on 7 May 1992 to elect members of St Albans City and District Council in England. This was on the same day as other local elections.

The 1994 St Albans City and District Council election took place on 5 May 1994 to elect members of St Albans City and District Council in England. This was on the same day as other local elections.

The 1995 St Albans City and District Council election took place on 4 May 1995 to elect members of St Albans City and District Council in England. This was on the same day as other local elections.

The 1996 St Albans City and District Council election took place on 2 May 1996 to elect members of St Albans City and District Council in England. This was on the same day as other local elections.

References

  1. "Results 1973 to 2012" (PDF). Colin Rallings and Michael Thrasher. The Elections Centre, Plymouth University . Retrieved 27 January 2023.