The 2019 Hertsmere Borough Council election took place on 2 May 2019 to elect members of the Hertsmere Borough Council in England. [1] It was held on the same day as other local elections.
2019 Hertsmere Borough Council election | ||||||||||
---|---|---|---|---|---|---|---|---|---|---|
Party | Candidates | Seats | Gains | Losses | Net gain/loss | Seats % | Votes % | Votes | +/− | |
Conservative | 39 | 29 | 0 | 7 | 8 | 74.4 | 54.3 | 30,298 | –3.3 | |
Labour | 39 | 7 | 4 | 0 | 5 | 17.9 | 28.3 | 15,779 | +1.2 | |
Liberal Democrats | 18 | 3 | 3 | 0 | 3 | 7.7 | 11.6 | 6,487 | +5.6 | |
Independent | 7 | 0 | 0 | 0 | 0.0 | 4.3 | 2,381 | +0.2 | ||
UKIP | 4 | 0 | 0 | 0 | 0.0 | 1.6 | 897 | –3.5 |
Party | Candidate | Votes | % | ±% | |
---|---|---|---|---|---|
Conservative | Lucy Selby | 1,097 | 71.0 | ||
Conservative | John Graham | 1,058 | 68.5 | ||
Independent | Sue Dickson | 251 | 16.2 | ||
Liberal Democrats | Saif Al-Saadoon | 204 | 13.2 | ||
Labour | David Harris | 160 | 10.4 | ||
Labour | Sandra Huff | 143 | 9.3 | ||
Turnout | |||||
Conservative hold | |||||
Party | Candidate | Votes | % | ±% | |
---|---|---|---|---|---|
Conservative | Caroline Clapper | 1,001 | 78.3 | ||
Conservative | David Lambert | 845 | 66.1 | ||
Liberal Democrats | Paul Watson | 197 | 15.4 | ||
Labour | Richard Kirk | 175 | 13.7 | ||
Labour | John Maizels | 160 | 12.5 | ||
Turnout | |||||
Conservative hold | |||||
Party | Candidate | Votes | % | ±% | |
---|---|---|---|---|---|
Conservative | Mike Reeve | 833 | 63.9 | ||
Conservative | Sarah Hodgson-Jones | 826 | 63.4 | ||
Labour | Harvey Ward | 408 | 31.3 | ||
Labour | Austin Harney | 368 | 28.2 | ||
Turnout | |||||
Conservative hold | |||||
Party | Candidate | Votes | % | ±% | |
---|---|---|---|---|---|
Conservative | Susan Brown | 830 | 41.3 | ||
Conservative | Alan Plancey | 827 | 41.2 | ||
Conservative | Glenn Briski | 731 | 36.4 | ||
Labour | Graeme Alexander | 711 | 35.4 | ||
Labour | Alpha Collins | 681 | 33.9 | ||
Labour | Prabhakar Kaza | 641 | 31.9 | ||
Independent | Gary Silver | 433 | 21.6 | ||
Independent | Eric Silver | 417 | 20.8 | ||
Independent | Katie Hunter | 301 | 15.0 | ||
Turnout | |||||
Conservative hold | |||||
Party | Candidate | Votes | % | ±% | |
---|---|---|---|---|---|
Labour | Richard Butler | 879 | 56.0 | ||
Labour | Michelle Vince | 866 | 55.2 | ||
Labour | Jeremy Newmark | 733 | 46.7 | ||
Conservative | Clive Butchins | 417 | 26.6 | ||
Conservative | Rodney Burt | 408 | 26.0 | ||
Conservative | Andy Grady | 390 | 24.9 | ||
UKIP | Lee Greenfield | 272 | 17.3 | ||
Turnout | |||||
Labour hold | |||||
Labour hold | |||||
Labour gain from Conservative |
Party | Candidate | Votes | % | ±% | |
---|---|---|---|---|---|
Conservative | Farida Turner | 700 | 40.1 | ||
Conservative | Victor Eni | 698 | 40.0 | ||
Conservative | Meenal Sachdev | 659 | 37.7 | ||
Labour | Rachel Shaw | 404 | 23.1 | ||
Labour | Mik Levin | 391 | 22.4 | ||
Labour | Henry Okonu | 390 | 22.3 | ||
Liberal Democrats | Andy Lewis | 315 | 18.0 | ||
Independent | Joe Hunter | 284 | 16.3 | ||
Liberal Democrats | Sophie Aldridge | 262 | 15.0 | ||
Liberal Democrats | Elaine Elliman | 248 | 14.2 | ||
UKIP | David Appleby | 224 | 12.8 | ||
Turnout | |||||
Conservative hold | |||||
Party | Candidate | Votes | % | ±% | |
---|---|---|---|---|---|
Labour | Rebecca Butler | 987 | 54.1 | ||
Conservative | Cynthia Barker | 822 | 45.0 | ||
Labour | Kumail Jaffer | 819 | 44.9 | ||
Labour | Dan Ozarow | 819 | 44.9 | ||
Conservative | Samantha Evans | 738 | 40.4 | ||
Conservative | Przemek De Skuba | 724 | 39.7 | ||
Turnout | |||||
Labour gain from Conservative | |||||
Conservative hold | |||||
Labour win (new seat) |
Party | Candidate | Votes | % | ±% | |
---|---|---|---|---|---|
Conservative | Paul Morris | 881 | 73.7 | ||
Conservative | Seamus Quilty | 870 | 72.7 | ||
Liberal Democrats | Roger Kutchinsky | 183 | 15.3 | ||
Liberal Democrats | Andrew Brass | 170 | 14.2 | ||
Labour | David Bearfield | 109 | 9.1 | ||
Labour | Abdul Jabarkhail | 80 | 6.7 | ||
Turnout | |||||
Conservative hold | |||||
Party | Candidate | Votes | % | ±% | |
---|---|---|---|---|---|
Liberal Democrats | Jeremy Evans | 744 | 42.5 | ||
Liberal Democrats | Andrew Melville | 743 | 42.5 | ||
Liberal Democrats | Paul Richards | 682 | 39.0 | ||
Conservative | Lawrence Davis | 597 | 34.1 | ||
Conservative | Jane West | 590 | 33.7 | ||
Conservative | Kashif Merchant | 477 | 27.3 | ||
Labour | John Barratt | 324 | 18.5 | ||
Labour | Sandy Mercado | 271 | 15.5 | ||
Labour | Fikile Mkoyana | 264 | 15.1 | ||
UKIP | Vikki Johnson | 196 | 11.2 | ||
Turnout | |||||
Liberal Democrats gain from Conservative | |||||
Liberal Democrats gain from Conservative |
Party | Candidate | Votes | % | ±% | |
---|---|---|---|---|---|
Conservative | Linda Silver | 1,241 | 64.1 | ||
Conservative | David Carter | 1,232 | 63.6 | ||
Conservative | Anne Swerling | 1,153 | 59.5 | ||
Liberal Democrats | Anne Diamond | 327 | 16.9 | ||
Labour | Carolyn Oakley | 309 | 16.0 | ||
Liberal Democrats | Brian Silverman | 296 | 15.3 | ||
Liberal Democrats | Judith Melinek | 290 | 15.0 | ||
Labour | Di Hoeksma | 286 | 14.8 | ||
Labour | Matthew McHale | 245 | 12.6 | ||
Turnout | |||||
Conservative hold | |||||
Conservative win (new seat) |
Party | Candidate | Votes | % | ±% | |
---|---|---|---|---|---|
Conservative | Peter Rutledge | 790 | 55.6 | ||
Conservative | Pervez Choudhury | 779 | 54.8 | ||
Conservative | Harry Mortimer | 762 | 53.6 | ||
Liberal Democrats | Holly Gunning | 363 | 25.5 | ||
Labour | Yue Cheng | 313 | 22.0 | ||
Liberal Democrats | Christopher Scobie | 312 | 21.9 | ||
Liberal Democrats | Hannah Uri | 307 | 21.6 | ||
Labour | David McGregor | 291 | 20.5 | ||
Labour | Mary Reid | 282 | 19.8 | ||
Turnout | 39.4 | ||||
Conservative hold | |||||
Party | Candidate | Votes | % | ±% | |
---|---|---|---|---|---|
Conservative | Harvey Cohen | 956 | 71.9 | ||
Conservative | Morris Bright | 927 | 69.8 | ||
Labour | Caroline Pitrakou | 202 | 15.2 | ||
Labour | Elsa Maguina | 194 | 14.6 | ||
Independent | Stella Hunter | 172 | 12.9 | ||
Turnout | 35.5 | ||||
Conservative hold | |||||
Party | Candidate | Votes | % | ±% | |
---|---|---|---|---|---|
Labour | Christian Gray | 611 | 45.4 | ||
Labour | Chris Myers | 583 | 43.3 | ||
Conservative | Peter Knell | 543 | 40.4 | ||
Conservative | Martin Worster | 508 | 37.8 | ||
UKIP | David Hoy | 205 | 15.2 | ||
Turnout | |||||
Labour gain from Conservative | |||||
Labour gain from Conservative |
Party | Candidate | Votes | % | ±% | |
---|---|---|---|---|---|
Conservative | Jean Heywood | 665 | 56.0 | ||
Conservative | Christine Lyon | 645 | 54.3 | ||
Labour | John Doolan | 459 | 38.7 | ||
Labour | Ann Harrison | 450 | 37.9 | ||
Turnout | |||||
Conservative hold | |||||
Party | Candidate | Votes | % | ±% | |
---|---|---|---|---|---|
Conservative | Paul Hodgson-Jones | 754 | 54.6 | ||
Conservative | Abhishek Sachdev | 683 | 49.5 | ||
Liberal Democrats | Jonathan Brett | 447 | 32.4 | ||
Liberal Democrats | Sachin Saggar | 397 | 28.7 | ||
Labour | Lynda Stoker | 190 | 13.8 | ||
Labour | Chris Shellard | 168 | 12.2 | ||
Turnout | 36.7 | ||||
Conservative hold | |||||
Party | Candidate | Votes | % | ±% | |
---|---|---|---|---|---|
Conservative | Natalie Susman | 776 | 56.0 | ||
Conservative | Anthony Spencer | 765 | 55.2 | ||
Independent | Rosemary Gilligan | 523 | 37.8 | ||
Labour | Ray Edge | 238 | 17.2 | ||
Labour | Helen Yenilmez | 175 | 12.6 | ||
Turnout | 35.8 | ||||
Conservative hold | |||||
Party | Candidate | Votes | % | ±% | |
---|---|---|---|---|---|
Conservative | Brett Rosehill | 776 | 49.0 | +8.6 | |
Labour | Dan Ozarow | 655 | 41.3 | -3.6 | |
Liberal Democrats | Andy Lewis | 104 | 6.6 | N/A | |
Green | John Humphries | 50 | 3.2 | N/A | |
Majority | 121 | 13.9 | |||
Turnout | 1,585 | ||||
Conservative gain from Labour | Swing | ||||
Party | Candidate | Votes | % | ±% | |
---|---|---|---|---|---|
Labour | Dan Ozarow | 1,119 | 53.3 | +12.0 | |
Conservative | David Neifeld | 828 | 39.4 | -9.6 | |
Liberal Democrats | Darren Diamond | 152 | 7.2 | +0.6 | |
Majority | 291 | 13.9 | |||
Turnout | 2,099 | ||||
Labour gain from Conservative | Swing | ||||
Party | Candidate | Votes | % | ±% | |
---|---|---|---|---|---|
Liberal Democrats | Alan Matthews | 1,136 | 49.2 | +6.7 | |
Conservative | Jane West | 785 | 34.0 | +0.3 | |
Labour | John Barratt | 265 | 11.5 | -7.0 | |
Green | Matt Wheeler | 125 | 5.4 | N/A | |
Majority | 351 | 15.2 | |||
Turnout | 2,311 | ||||
Liberal Democrats hold | Swing | ||||
Welwyn Hatfield is a local government district with borough status in the county of Hertfordshire, England. Its council is based in Welwyn Garden City. The borough borders Hertsmere, St Albans, North Hertfordshire, East Hertfordshire, Broxbourne, and the London Borough of Enfield.
Hertsmere is a local government district with borough status in Hertfordshire, England. Its council is based in Borehamwood. Other settlements in the borough include Bushey, Elstree, Radlett and Potters Bar. The borough contains several film studios, including Elstree Studios and the BBC Elstree Centre at Borehamwood. The borough borders Three Rivers, Watford, St Albans, and Welwyn Hatfield in Hertfordshire and the three north London boroughs of Harrow, Barnet and Enfield. Hertsmere is located mainly within the M25 Motorway.
Hertsmere is a constituency in Hertfordshire, England, represented in the House of Commons since 2015 by Oliver Dowden, who currently serves as deputy prime minister.
Hertsmere Borough Council elections are held every four years to elect members of Hertsmere Borough Council in Hertfordshire, England. Since the last boundary changes in 2019, the council comprises 39 councillors elected from 16 wards.
The 1998 Hertsmere Borough Council election took place on 7 May 1998 to elect members of Hertsmere District Council in Hertfordshire, England. One third of the council was up for election and the Labour party stayed in overall control of the council.
The 1999 Hertsmere Borough Council election took place on 6 May 1999 to elect members of Hertsmere Borough Council in Hertfordshire, England. The whole council was up for election with boundary changes since the last election in 1998. The Conservative party gained overall control of the council from the Labour party.
The 2000 Hertsmere Borough Council election took place on 4 May 2000 to elect members of Hertsmere Borough Council in Hertfordshire, England. One third of the council was up for election and the Conservative Party stayed in overall control of the council.
The 2002 Hertsmere Borough Council election took place on 2 May 2002 to elect members of Hertsmere Borough Council in Hertfordshire, England. One third of the council was up for election and the Conservative Party stayed in overall control of the council.
The 2003 Hertsmere Borough Council election took place on 1 May 2003 to elect members of Hertsmere Borough Council in Hertfordshire, England. One third of the council was up for election and the Conservative Party stayed in overall control of the council.
The 2004 Hertsmere Borough Council election took place on 10 June 2004 to elect members of Hertsmere Borough Council in Hertfordshire, England. One third of the council was up for election and the Conservative Party stayed in overall control of the council.
The 2006 Hertsmere Borough Council election took place on 4 May 2006 to elect members of Hertsmere Borough Council in Hertfordshire, England. One third of the council was up for election and the Conservative Party stayed in overall control of the council.
The 2007 Hertsmere Borough Council election took place on 3 May 2007 to elect members of Hertsmere Borough Council in Hertfordshire, England. One third of the council was up for election and the Conservative Party stayed in overall control of the council.
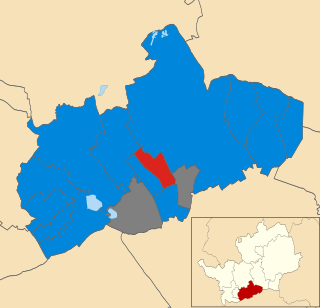
The 2008 Hertsmere Borough Council election took place on 1 May 2008 to elect members of Hertsmere Borough Council in Hertfordshire, England. One third of the council was up for election and the Conservative Party stayed in overall control of the council.
The 2010 Hertsmere Borough Council election took place on 6 May 2010 to elect members of Hertsmere Borough Council in Hertfordshire, England. One third of the council was up for election and the Conservative Party stayed in overall control of the council.
The 2011 Hertsmere Borough Council election took place on 5 May 2011 to elect members of Hertsmere Borough Council in Hertfordshire, England. One third of the council was up for election and the Conservative Party stayed in overall control of the council.
The 2012 Hertsmere Borough Council election took place on 3 May 2012 to elect members of the Hertsmere Borough Council in England. It was held on the same day as other 2012 United Kingdom local elections.
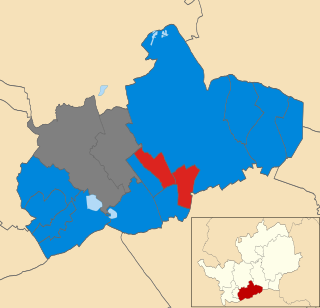
The 2014 Hertsmere Borough Council election took place on 22 May 2014 to elect members of Hertsmere Borough Council in England. This was on the same day as other local elections.
The 2015 Hertsmere Borough Council election took place on 7 May 2015 to elect members of the Hertsmere Borough Council in England. It was held on the same day as other local elections.
The 2023 Hertsmere Borough Council election took place on 4 May 2023 to elect members of Hertsmere Borough Council in Hertfordshire, England. This was on the same day as other local elections across England.