| |||||||||||||||||||||||||||||||||
All 47 seats to Erewash Borough Council 24 seats needed for a majority | |||||||||||||||||||||||||||||||||
---|---|---|---|---|---|---|---|---|---|---|---|---|---|---|---|---|---|---|---|---|---|---|---|---|---|---|---|---|---|---|---|---|---|
| |||||||||||||||||||||||||||||||||
Results by ward | |||||||||||||||||||||||||||||||||
|
The 2019 Erewash Borough Council election was held on 2 May 2019 to elect members of Erewash Borough Council in Derbyshire, England. The whole council was up for election. [1]
2019 Erewash Borough Council election | ||||||||||
---|---|---|---|---|---|---|---|---|---|---|
Party | Candidates | Seats | Gains | Losses | Net gain/loss | Seats % | Votes % | Votes | +/− | |
Conservative | 47 | 27 | 0 | 3 | 3 | 57.5 | 47.6 | 14,071 | +7.7 | |
Labour | 47 | 19 | 2 | 0 | 2 | 40.4 | 37.4 | 11,057 | +4.8 | |
Liberal Democrats | 19 | 1 | 1 | 0 | 1 | 2.1 | 12.5 | 3,701 | +9.4 | |
UKIP | 2 | 0 | 0 | 0 | 0.0 | 1.7 | 508 | –20.1 | ||
Independent | 1 | 0 | 0 | 0 | 0.0 | 0.7 | 198 | +0.2 |
Party | Candidate | Votes | % | ±% | |
---|---|---|---|---|---|
Labour | Glennice Birkin (E) | 434 | 43.8 | ||
Labour | James Clifford Hedley Dawson (E) | 408 | 49.3 | ||
UKIP | Frank Dunne | 291 | 33.0 | ||
Conservative | Caroline Lesley Crick | 267 | 30.3 | ||
Conservative | Lachlan Gordon Forbes-Sutherland | 221 | 25.1 | ||
Turnout | 881 | 27.3 | |||
Labour hold | Swing | ||||
Party | Candidate | Votes | % | ±% | |
---|---|---|---|---|---|
Conservative | Kevin Philip Miller (E) | 917 | 59.7 | ||
Conservative | Robert Alan Parkinson (E) | 887 | 57.8 | ||
Labour | Nicky Carless | 289 | 18.8 | ||
Labour | Simon Mark Hemmings | 263 | 17.1 | ||
Liberal Democrats | Alex Richard | 240 | 15.6 | ||
Independent | John Michael Lawson | 198 | 12.9 | ||
Liberal Democrats | Jenny Smith | 148 | 9.6 | ||
Turnout | 1,535 | 41.6 | |||
Conservative hold | Swing | ||||
Party | Candidate | Votes | % | ±% | |
---|---|---|---|---|---|
Labour | Jane Wilson (E) | 457 | 53.3 | ||
Labour | Danny Treacy (E) | 446 | 52.0 | ||
Conservative | Maria Smith | 357 | 41.7 | ||
Conservative | John Howard Beardsley | 340 | 39.7 | ||
Turnout | 857 | 24.3 | |||
Labour hold | Swing | ||||
Party | Candidate | Votes | % | ±% | |
---|---|---|---|---|---|
Labour | Margaret Griffths (E) | 719 | 64.5 | ||
Labour | Howard Griffiths (E) | 702 | 63.0 | ||
Conservative | Richard James Griffths | 349 | 31.3 | ||
Conservative | John Clifford Stephen Wheatley | 344 | 30.9 | ||
Turnout | 1,114 | 30.5 | |||
Labour hold | Swing | ||||
Party | Candidate | Votes | % | ±% | |
---|---|---|---|---|---|
Conservative | Gary Hickton (E) | 908 | |||
Conservative | Dan Pitt | 881 | |||
Conservative | Gerri Hickton (E) | 880 | |||
Labour | Andy Coles | 760 | |||
Labour | Samantha Niblett | 755 | |||
Labour | Andrew Peck | 743 | |||
Liberal Democrats | Jane Oseman | 352 | |||
Liberal Democrats | Ian Neill | 324 | |||
Liberal Democrats | Keith Oseman | 297 | |||
Conservative hold | Swing | ||||
Party | Candidate | Votes | % | ±% | |
---|---|---|---|---|---|
Conservative | Val Clare | 719 | 64.1 | ||
Conservative | Tim Scott | 655 | 58.4 | ||
Labour | Coral McDonnell | 394 | 35.1 | ||
Labour | Liam Collard | 344 | 30.7 | ||
Turnout | 1,122 | 35.0 | |||
Conservative hold | Swing | ||||
Party | Candidate | Votes | % | ±% | |
---|---|---|---|---|---|
Labour | Pamela Eileen Ashley (E) | 516 | 50.8 | ||
Labour | Alexander Phillips (E) | 469 | 46.2 | ||
Conservative | Jonathan William Wright | 466 | 45.9 | ||
Conservative | Ryan Jonathan Pound | 453 | 44.6 | ||
Turnout | 1,015 | 28.2 | |||
Labour hold | Swing | ||||
Labour gain from Conservative | Swing | ||||
Party | Candidate | Votes | % | ±% | |
---|---|---|---|---|---|
Labour | John Arnold Frudd (E) | 736 | 54.0 | ||
Labour | Steve Green (E) | 722 | 53.0 | ||
Labour | Linda Marie Frudd (E) | 709 | 52.0 | ||
Conservative | Paul Horace George Harvey | 543 | 39.8 | ||
Conservative | Tony King | 504 | 37.0 | ||
Conservative | Kevin Roger Tribbensee | 466 | 34.2 | ||
Turnout | 1,363 | 28.2 | |||
Labour hold | Swing | ||||
Party | Candidate | Votes | % | ±% | |
---|---|---|---|---|---|
Labour | Pamela Phillips (E) | 800 | 50.8 | ||
Labour | Frank Charles Phillips (E) | 788 | 50.0 | ||
Labour | Phillipa Jemma Tatham (E) | 776 | 49.2 | ||
Conservative | Helen Joyce Wright | 643 | 40.8 | ||
Conservative | Peter Hopkinson | 641 | 40.7 | ||
Conservative | John Alexander Russell Green | 601 | 38.1 | ||
Turnout | 1,576 | 26.3 | |||
Labour hold | Swing | ||||
Party | Candidate | Votes | % | ±% | |
---|---|---|---|---|---|
Conservative | Abey Stevenson (E) | 789 | 55.4 | ||
Conservative | Alan Summerfield (E) | 757 | 53.2 | ||
Labour | Ian Wilson | 307 | 21.6 | ||
Labour | Cherryl Thomson | 262 | 18.4 | ||
Liberal Democrats | Jill Mee | 259 | 18.2 | ||
UKIP | David Charles Adams | 217 | 15.2 | ||
Turnout | 1,423 | 39.8 | |||
Conservative hold | Swing | ||||
Party | Candidate | Votes | % | ±% | |
---|---|---|---|---|---|
Conservative | Mary Hopkinson (E) | 635 | 52.5 | ||
Conservative | Sue Beardsley (E) | 616 | 51.0 | ||
Labour | Dan Whittle | 529 | 43.8 | ||
Labour | Darby Hutchby | 520 | 43.0 | ||
Turnout | 1,209 | 35.5 | |||
Conservative hold | Swing | ||||
Party | Candidate | Votes | % | ±% | |
---|---|---|---|---|---|
Labour | Caroline Elizabeth Louise Brown (E) | 837 | 46.1 | ||
Labour | Denise Ann Mellors (E) | 783 | 43.1 | ||
Conservative | Donna Anne Briggs (E) | 731 | 40.3 | ||
Labour | Adam Thompson | 723 | 39.8 | ||
Conservative | Alan Griffiths | 706 | 38.9 | ||
Conservative | Peter George Pepios | 664 | 36.6 | ||
Liberal Democrats | Rachel Allen | 281 | 15.5 | ||
Liberal Democrats | Kristopher James Watts | 208 | 11.5 | ||
Liberal Democrats | Rodney Wilby Allen | 198 | 10.9 | ||
Turnout | 1,815 | 33.0 | |||
Labour hold | Swing | ||||
Conservative hold | Swing | ||||
Party | Candidate | Votes | % | ±% | |
---|---|---|---|---|---|
Labour | Diane Fletcher | 719 | 53.4 | ||
Labour | Gordon Thomas | 693 | 51.4 | ||
Conservative | Bryn James Lewis | 580 | 43.1 | ||
Conservative | Chris Page | 539 | 40.0 | ||
Turnout | 1,347 | 37.2 | |||
Labour hold | Swing | ||||
Party | Candidate | Votes | % | ±% | |
---|---|---|---|---|---|
Conservative | Mike Wallis | 1,236 | 59.0 | ||
Conservative | Michael William White | 1,175 | 56.1 | ||
Conservative | Terry Holbrook | 1,166 | 55.7 | ||
Labour | Neil Barnes | 642 | 30.7 | ||
Liberal Democrats | David Nibby | 511 | 24.4 | ||
Labour | Sam Smith | 488 | 23.3 | ||
Labour | Ian Thomson | 459 | 21.9 | ||
Turnout | 2,094 | 37.5 | |||
Conservative hold | Swing | ||||
Party | Candidate | Votes | % | ±% | |
---|---|---|---|---|---|
Conservative | Steve Bilbie (E) | 1,153 | 54.5 | ||
Conservative | Wayne Stephen Major (E) | 1,101 | 52.0 | ||
Conservative | Tony Sanghera (E) | 1,021 | 48.3 | ||
Labour | Celia Jane Powers | 823 | 38.9 | ||
Labour | Alan Lambert | 728 | 34.4 | ||
Labour | Geoff Stratford | 674 | 31.9 | ||
Liberal Democrats | Martin Lowe | 301 | 14.2 | ||
Turnout | 2,116 | 35.1 | |||
Conservative hold | Swing | ||||
Party | Candidate | Votes | % | ±% | |
---|---|---|---|---|---|
Conservative | John Richard Sewell (E) | 789 | 44.8 | ||
Labour | Denise Bond (E) | 745 | 42.3 | ||
Conservative | Paul Francis Maginnis (E) | 724 | 41.1 | ||
Labour | Alan Chewings | 711 | 40.3 | ||
Labour | Dave Doyle | 668 | 37.9 | ||
Conservative | Heather Wrigglesworth | 651 | 36.9 | ||
Liberal Democrats | Fiona Aanonson | 331 | 18.8 | ||
Liberal Democrats | Peter Aanonson | 267 | 15.1 | ||
Turnout | 1,763 | 35.1 | |||
Conservative hold | Swing | ||||
Labour gain from Conservative | Swing | ||||
Conservative hold | Swing | ||||
Party | Candidate | Votes | % | ±% | |
---|---|---|---|---|---|
Conservative | Val Custance | 707 | 54.9 | ||
Conservative | Paul Chad Shelton | 613 | 47.6 | ||
Labour | Jo Ward | 576 | 44.7 | ||
Labour | Mark Alan Hutchby | 533 | 41.4 | ||
Turnout | 1,288 | 35.1 | |||
Conservative hold | Swing | ||||
Party | Candidate | Votes | % | ±% | |
---|---|---|---|---|---|
Conservative | Carol Ann Hart (E) | 1,131 | 52.1 | ||
Liberal Democrats | Robert Mark Mee (E) | 1,025 | 47.2 | ||
Conservative | Diane Hilda Cox (E) | 901 | 41.5 | ||
Liberal Democrats | Peter James Davey | 785 | 36.2 | ||
Conservative | Robert Frederick Flatley | 748 | 34.5 | ||
Liberal Democrats | Susannah Louise Watts | 715 | 32.9 | ||
Labour | Sharon Hutchby | 222 | 10.2 | ||
Labour | Dave Morgan | 193 | 8.9 | ||
Labour | Abigail Roberts | 181 | 8.3 | ||
Turnout | 2,171 | 42.6 | |||
Conservative hold | Swing | ||||
Liberal Democrats gain from Conservative | Swing | ||||
Conservative hold | Swing | ||||
Party | Candidate | Votes | % | ±% | |
---|---|---|---|---|---|
Conservative | Kewal Singh Athwal (E) | 1,151 | 55.4 | ||
Conservative | Chris Corbett (E) | 1,099 | 52.9 | ||
Conservative | Michael Charlesworth Powell (E) | 1,008 | 48.5 | ||
Labour | Mike Martin | 552 | 26.6 | ||
Labour | Shirley Dickman | 493 | 23.7 | ||
Labour | Trevor Page | 442 | 21.3 | ||
Liberal Democrats | James Martin Archer | 401 | 19.3 | ||
Liberal Democrats | Rebecca Karen Wain | 343 | 16.5 | ||
Liberal Democrats | Adam David Wain | 326 | 15.7 | ||
Turnout | 2,078 | 36.3 | |||
Conservative hold | Swing | ||||
Party | Candidate | Votes | % | ±% | |
---|---|---|---|---|---|
Conservative | Jon Wright | 683 | 54.1 | +8.2 | |
Labour | Jo Ward | 507 | 40.1 | -10.7 | |
Liberal Democrats | Angela Togni | 73 | 5.8 | N/A | |
Turnout | 1,263 | ||||
Conservative gain from Labour | Swing | ||||
Party | Candidate | Votes | % | ±% | |
---|---|---|---|---|---|
Conservative | Bryn James Lewis | 707 | 51.5 | +8.4 | |
Labour | Adam Thompson | 509 | 37.0 | -16.4 | |
Green | Lee Charles Fletcher | 110 | 8.0 | N/A | |
Liberal Democrats | Rodney Wilby Allen | 47 | 3.5 | N/A | |
Turnout | 1,373 | ||||
Conservative gain from Labour | Swing | ||||
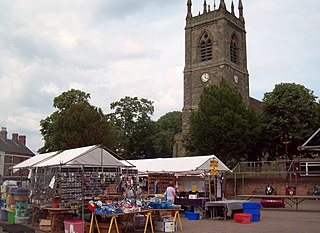
Erewash is a local government district with borough status in Derbyshire, England. The borough is named after the River Erewash. The council has offices in both the borough's towns of Ilkeston and Long Eaton. The borough also includes several villages and surrounding rural areas. Some of the built-up areas in the east of the borough form part of the Nottingham Urban Area.
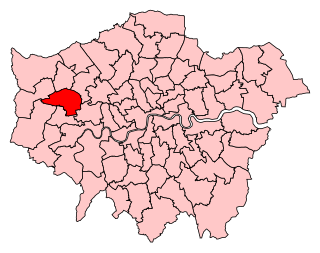
Ealing North is a constituency, created in 1950. Since the 2019 general election, it has been represented in the House of Commons of the UK Parliament by James Murray of Labour Co-op.
Erewash is a constituency in Derbyshire represented in the House of Commons of the UK Parliament since 2015 by Maggie Throup, a Conservative.
Dacorum Borough Council in Hertfordshire, England is elected every four years. Since the last boundary changes in 2007, 51 councillors have been elected from 25 wards.
Brighton and Hove City Council is a unitary authority in East Sussex, England. It was created as Brighton and Hove Borough Council on 1 April 1997 replacing Brighton and Hove Borough Councils. It was granted city status in 2001.
Darlington Borough Council elections are held every four years. Darlington Borough Council is the local authority for the unitary authority of Darlington in County Durham, England. Until 1 April 1997 it was a non-metropolitan district.
Derbyshire County Council is the upper-tier local authority for the non-metropolitan county of Derbyshire in England. The council is based at County Hall in Matlock. Since 2017 the council has been under Conservative majority control.
Wrexham County Borough Council is the governing body for Wrexham County Borough, a principal area with city status in north Wales, covering Wrexham and the surrounding area.
One third of Tunbridge Wells Borough Council in Kent, England, is elected each year, followed by one year without election. Since the last boundary changes in 2002, 48 councillors have been elected from 20 wards.
Redcar and Cleveland Borough Council is the local authority for the unitary authority of Redcar and Cleveland in North Yorkshire, England. Until 1 April 1996 it was a non-metropolitan district in Cleveland, called Langbaurgh.
Erewash Borough Council elections are held every four years. Erewash Borough Council is the local authority for the non-metropolitan district of Erewash in Derbyshire, England. Since the last boundary changes in 2015, 47 councillors are elected from 19 wards.
One third of Woking Borough Council in Surrey, England is elected each year, followed by one year without election. Since the last boundary changes in 2016, 30 councillors have been elected from 10 wards.
Elections to Test Valley Borough Council were held on 5 May 2011, the same day as the 2011 United Kingdom Alternative Vote referendum. The Conservatives maintained control of the council, with an increased majority.
The 2011 Erewash Borough Council election took place on 5 May 2011 to elect members of Erewash Borough Council in Derbyshire, England. The whole council was up for election.
Wirral Council is the local authority of the Metropolitan Borough of Wirral in Merseyside, England. Wirral is a metropolitan borough, one of five in Merseyside, and provides the majority of local government services in Wirral. The council is a constituent member of the Liverpool City Region Combined Authority.
The 2007 Erewash Borough Council election took place on 3 May 2007 to elect members of Erewash Borough Council in Derbyshire, England. The whole council was up for election.
Elections to Erewash District Council were held on 10 May 1973 as part of nationwide local elections. The new district was formed by the merger of the Borough of Ilkeston, the Long Eaton urban district and the parishes of Breadsall, Breaston, Dale Abbey, Draycott and Church Wilne, Hopwell, Little Eaton, Morley, Ockbrook, Risley, Sandiacre, Stanley, Stanton by Dale and West Hallam from the South East Derbyshire Rural District. The new council became a shadow authority before taking over from the existing local authorities on 1 April 1974. The election saw the Labour Party gain control of the Council. Erewash District Council was granted Borough Status in 1975 and from thereon became known as Erewash Borough Council.
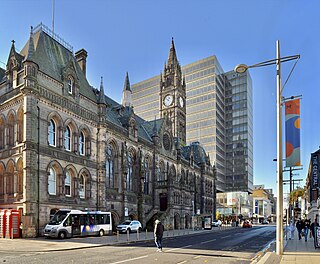
The Borough of Middlesbrough is a borough with unitary authority status in North Yorkshire, England, based around the town of Middlesbrough in the north of the county. It is part of the Tees Valley combined authority, along with Stockton-on-Tees, Redcar and Cleveland, Hartlepool and Darlington boroughs. Nunthorpe along with Stainton and Thornton have statutory parish councils.
Elections to Basingstoke and Deane Borough Council took place on 6 May 2021 as part of the 2021 United Kingdom local elections. They took place at the same time as the elections for Hampshire County Council and the Hampshire Police and Crime Commissioner.
Elections to Ipswich Borough Council (IBC) are currently taking place as of 5 May 2022. 17 seats will be contested – one in each of the 16 wards, plus an additional bye election in St John's Ward.