Results maps
 2003 results map
 2007 results map
 2011 results map
 2015 results map
 2019 results map
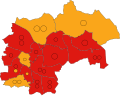 2023 results map
Chesterfield Borough Council elections are held every four years. Chesterfield Borough Council is the local authority for the non-metropolitan district of Chesterfield in Derbyshire, England. Since the last boundary changes in 2003, 48 councillors have been elected from 19 wards. [1] However, the 2023 elections will be fought under new boundaries with the number of Councillors reducing from 48 to 40.
Chesterfield was a municipal borough from 1836 until 1974. [2] The borough was reformed under the Local Government Act 1972, gaining Staveley and Brimington and becoming a non-metropolitan district. The first election to the reformed council was held in 1973, initially operating as a shadow authority before coming into its powers on 1 April 1974. Since 1973 political control of the council has been held by the following parties: [3] [4]
| Party in control | Years | |
|---|---|---|
| Labour | 1973–2003 | |
| Liberal Democrats | 2003–2011 | |
| Labour | 2011–present | |
The leaders of the council since 2001 have been: [5]
| Councillor | Party | From | To | |
|---|---|---|---|---|
| Bill Flanagan | Labour | May 1974 | 2001 | |
| John Burrows [6] | Labour | 2001 | May 2003 | |
| Ray Russell | Liberal Democrats | May 2003 | 18 May 2011 | |
| John Burrows | Labour | 18 May 2011 | 10 May 2017 | |
| Tricia Gilby | Labour | 10 May 2017 | ||


| Party | Candidate | Votes | % | ±% | |
|---|---|---|---|---|---|
| Liberal Democrats | 809 | 48.3 | |||
| Conservative | 545 | 32.5 | |||
| Labour | 322 | 19.2 | |||
| Majority | 264 | 15.8 | |||
| Turnout | 1,676 | 44.6 | |||
| Liberal Democrats hold | Swing | ||||
| Party | Candidate | Votes | % | ±% | |
|---|---|---|---|---|---|
| Liberal Democrats | 1,068 | 54.5 | |||
| Labour | 812 | 41.5 | |||
| Conservative | 78 | 4.0 | |||
| Majority | 256 | 13.0 | |||
| Turnout | 1,958 | 51.5 | |||
| Liberal Democrats gain from Labour | Swing | ||||
| Party | Candidate | Votes | % | ±% | |
|---|---|---|---|---|---|
| Liberal Democrats | 1,115 | 64.8 | +3.1 | ||
| Labour | 569 | 33.1 | −2.5 | ||
| Conservative | 37 | 2.1 | −0.6 | ||
| Majority | 546 | 31.7 | |||
| Turnout | 1,721 | 45.6 | |||
| Liberal Democrats hold | Swing | ||||
| Party | Candidate | Votes | % | ±% | |
|---|---|---|---|---|---|
| Liberal Democrats | Jean Barr | 895 | 65.8 | +5.1 | |
| Labour | Thomas Murphy | 431 | 31.6 | −5.6 | |
| Conservative | Gary Hatton | 36 | 2.6 | +2.6 | |
| Majority | 464 | 34.2 | |||
| Turnout | 1,362 | 40.9 | |||
| Liberal Democrats hold | Swing | ||||
| Party | Candidate | Votes | % | ±% | |
|---|---|---|---|---|---|
| Labour | John Haywood | 1,500 | 47.9 | +4.1 | |
| Liberal Democrats | Stephen Hartley | 1,134 | 36.2 | −12.6 | |
| Conservative | Gary Hatton | 499 | 15.9 | +8.5 | |
| Majority | 366 | 11.7 | |||
| Turnout | 3,133 | 65.3 | |||
| Labour gain from Liberal Democrats | Swing | ||||
| Party | Candidate | Votes | % | ±% | |
|---|---|---|---|---|---|
| Liberal Democrats | Tony Rogers | 532 | 47.1 | +12.1 | |
| Labour | Ron Mihaly | 445 | 39.4 | −9.9 | |
| Conservative | Gordon Franklin Partington | 84 | 7.4 | −8.3 | |
| UKIP | Barry Thompson | 69 | 6.1 | 6.1 | |
| Majority | 87 | 7.7 | |||
| Turnout | 1,130 | 31 | |||
| Liberal Democrats gain from Labour | Swing | ||||
| Party | Candidate | Votes | % | ±% | |
|---|---|---|---|---|---|
| Labour | Debbie Wheeldon | 747 | 48.5 | +15.2 | |
| Independent | Dean Rhodes | 676 | 43.9 | +43.9 | |
| Green | Louis Hollingworth | 118 | 7.7 | +7.7 | |
| Majority | 71 | 4.6 | |||
| Turnout | 1,541 | ||||
| Labour gain from Independent | Swing | ||||
| Party | Candidate | Votes | % | ±% | |
|---|---|---|---|---|---|
| Labour | Sharon Blank | 1,521 | 45.1 | ||
| Liberal Democrats | Ed Fordham | 621 | 18.4 | ||
| Green | Vicky Noble | 511 | 15.2 | ||
| Conservative | Jacob Rodgers | 499 | 14.8 | ||
| Chesterfield And North Derbyshire Independents | Kris Stone | 220 | 6.5 | ||
| Majority | 900 | 26.7 | |||
| Turnout | 3,372 | ||||
| Labour hold | Swing | ||||
| Party | Candidate | Votes | % | ±% | |
|---|---|---|---|---|---|
| Labour | Steve Lismore | 635 | 34.4 | ||
| Liberal Democrats | Stephen Hartley | 592 | 32.1 | ||
| Conservative | Harry Smith | 278 | 15.1 | ||
| Independent | Martin Hibbert | 188 | 10.2 | ||
| Green | Joshua Ward | 151 | 8.2 | ||
| Majority | 43 | 2.3 | |||
| Turnout | 1,844 | ||||
| Labour gain from Liberal Democrats | Swing | ||||