Election maps
 2003 results map
 2007 results map
 2011 results map
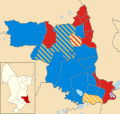
 2015 results map
 2019 results map
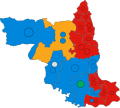 2023 results map
Erewash Borough Council elections are held every four years. Erewash Borough Council is the local authority for the non-metropolitan district of Erewash in Derbyshire, England. Since the last boundary changes in 2015, 47 councillors are elected from 19 wards. [1]
| Year | Conservative | Labour | Liberal Democrats | Liberal | Green | Independent | Control |
|---|---|---|---|---|---|---|---|
| 1973 | 9 | 36 | - | 5 | - | 4 | Labour |
| 1976 | 37 | 4 | - | 5 | - | 8 [a] | Conservative |
| 1979 | 30 | 17 | - | 1 | - | 3 [b] | Conservative |
| 1983 | 28 | 20 | - | 0 | - | 3 [c] | Conservative |
| 1987 | 29 | 21 | - | 0 | - | 2 | Conservative |
| 1991 | 22 | 27 | 1 | - | 0 | 2 | Labour |
| 1995 | 8 | 40 | 2 | - | 0 | 2 | Labour |
| 1999 | 15 | 29 | 4 | - | 0 | 4 | Labour |
| 2003 | 26 | 19 | 4 | - | 0 | 2 | Conservative |
| 2007 | 30 | 18 | 2 | - | 0 | 1 | Conservative |
| 2011 | 26 | 25 | 0 | - | 0 | 0 | Conservative |
| 2015 | 30 | 17 | 0 | - | 0 | 0 | Conservative |
| 2019 | 27 | 19 | 1 | - | 0 | 0 | Conservative |
| 2023 | 16 | 28 | 1 | - | 1 | 1 | Labour |


| Party | Candidate | Votes | % | ±% | |
|---|---|---|---|---|---|
| Labour | 331 | 71.6 | −11.2 | ||
| Conservative | 97 | 21.0 | +3.7 | ||
| Liberal Democrats | 34 | 7.4 | +7.4 | ||
| Majority | 234 | 50.6 | |||
| Turnout | 462 | ||||
| Labour hold | Swing | ||||
| Party | Candidate | Votes | % | ±% | |
|---|---|---|---|---|---|
| Liberal Democrats | 704 | 60.6 | +23.4 | ||
| Conservative | 308 | 26.5 | −2.4 | ||
| Labour | 150 | 12.9 | −21.1 | ||
| Majority | 396 | 34.1 | |||
| Turnout | 1,162 | ||||
| Liberal Democrats hold | Swing | ||||
| Party | Candidate | Votes | % | ±% | |
|---|---|---|---|---|---|
| Liberal Democrats | 733 | 48.4 | +29.1 | ||
| Conservative | 402 | 26.5 | +14.4 | ||
| Labour | 380 | 25.1 | +6.6 | ||
| Majority | 331 | 21.9 | |||
| Turnout | 1,515 | 28.8 | |||
| Liberal Democrats gain from Conservative | Swing | ||||
| Party | Candidate | Votes | % | ±% | |
|---|---|---|---|---|---|
| Conservative | 432 | 43.2 | +8.8 | ||
| Liberal Democrats | 416 | 41.6 | −3.6 | ||
| Labour | 151 | 15.1 | −5.3 | ||
| Majority | 16 | 1.6 | |||
| Turnout | 999 | 30.1 | |||
| Conservative gain from Liberal Democrats | Swing | ||||
| Party | Candidate | Votes | % | ±% | |
|---|---|---|---|---|---|
| Conservative | 433 | 46.6 | −6.0 | ||
| Liberal Democrats | 375 | 40.3 | +27.4 | ||
| Labour | 122 | 13.1 | −21.5 | ||
| Majority | 58 | 6.3 | |||
| Turnout | 930 | 24.0 | |||
| Conservative hold | Swing | ||||
| Party | Candidate | Votes | % | ±% | |
|---|---|---|---|---|---|
| Labour | 294 | 42.1 | −20.6 | ||
| Independent | 205 | 29.4 | +29.4 | ||
| Conservative | 199 | 28.5 | −8.8 | ||
| Majority | 89 | 12.7 | |||
| Turnout | 698 | 17.9 | |||
| Labour hold | Swing | ||||
| Party | Candidate | Votes | % | ±% | |
|---|---|---|---|---|---|
| Conservative | 627 | 63.0 | +17.1 | ||
| Liberal Democrats | 368 | 37.0 | +0.9 | ||
| Majority | 259 | 26.0 | |||
| Turnout | 995 | 35.2 | |||
| Conservative hold | Swing | ||||
| Party | Candidate | Votes | % | ±% | |
|---|---|---|---|---|---|
| Labour | Louis Booth | 523 | 52.1 | +23.4 | |
| Liberal Democrats | 232 | 23.1 | −1.5 | ||
| Conservative | 120 | 11.9 | −1.4 | ||
| UKIP | 129 | 12.8 | +12.8 | ||
| Majority | 291 | 29.0 | |||
| Turnout | 1,004 | 21.2 | |||
| Labour hold | Swing | ||||
| Party | Candidate | Votes | % | ±% | |
|---|---|---|---|---|---|
| Conservative | 423 | 38.1 | +29.4 | ||
| Labour | 348 | 31.4 | +21.4 | ||
| Liberal Democrats | 338 | 30.5 | +0.0 | ||
| Majority | 75 | 6.7 | |||
| Turnout | 1,109 | 21.7 | |||
| Conservative gain from Liberal Democrats | Swing | ||||
| Party | Candidate | Votes | % | ±% | |
|---|---|---|---|---|---|
| Labour | 707 | 77.0 | +24.9 | ||
| Conservative | 132 | 14.4 | +2.5 | ||
| Liberal Democrats | 79 | 8.6 | −14.5 | ||
| Majority | 575 | 62.6 | |||
| Turnout | 918 | 19.3 | |||
| Labour gain from Independent | Swing | ||||
| Party | Candidate | Votes | % | ±% | |
|---|---|---|---|---|---|
| Labour | Keri Andrews | 696 | 39.0 | +6.7 | |
| Conservative | Elaine Wright | 584 | 32.7 | −12.7 | |
| Liberal Democrats | Ian Neil | 301 | 16.9 | −5.4 | |
| BNP | Mark Bailey | 205 | 11.5 | +11.5 | |
| Majority | 112 | 6.3 | |||
| Turnout | 1,786 | ||||
| Labour gain from Conservative | Swing | ||||
| Party | Candidate | Votes | % | ±% | |
|---|---|---|---|---|---|
| Conservative | Kathryn Major | 471 | 53.4 | +2.1 | |
| Labour | James Dawson | 306 | 34.7 | −14.0 | |
| Liberal Democrats | Peter Aanonson | 105 | 11.9 | +11.9 | |
| Majority | 165 | 18.7 | |||
| Turnout | 882 | 23.0 | |||
| Conservative hold | Swing | ||||
| Party | Candidate | Votes | % | ±% | |
|---|---|---|---|---|---|
| Conservative | Bruce Broughton | 692 | 51.4 | −22.6 | |
| Liberal Democrats | Gary Hamson | 506 | 37.6 | +37.6 | |
| Labour | James Dawson | 149 | 11.1 | −15.0 | |
| Majority | 186 | 13.8 | |||
| Turnout | 1,347 | 33.8 | |||
| Conservative hold | Swing | ||||
| Party | Candidate | Votes | % | ±% | |
|---|---|---|---|---|---|
| Conservative | Jon Wright | 683 | 54.1 | ||
| Labour | Jo Ward | 507 | 40.1 | ||
| Liberal Democrats | Angela Togni | 73 | 5.8 | ||
| Majority | 176 | 13.9 | |||
| Turnout | 1,263 | ||||
| Conservative gain from Labour | Swing | ||||
| Party | Candidate | Votes | % | ±% | |
|---|---|---|---|---|---|
| Conservative | Bryn Lewis | 707 | 51.5 | ||
| Labour | Adam Thompson | 509 | 37.1 | ||
| Green | Lee Fletcher | 110 | 8.0 | ||
| Liberal Democrats | Rodney Allen | 47 | 3.4 | ||
| Majority | 198 | 14.4 | |||
| Turnout | 1,373 | ||||
| Conservative gain from Labour | Swing | ||||
| Party | Candidate | Votes | % | ±% | |
|---|---|---|---|---|---|
| Reform | Dan Price | 591 | 57.7 | ||
| Labour | Paul Opiah | 175 | 17.1 | ||
| Conservative | Sue Beardsley | 137 | 13.4 | ||
| Green | Lauren McKie | 61 | 6.0 | ||
| Liberal Democrats | Angela Togni | 61 | 6.0 | ||
| Majority | 416 | 40.6 | |||
| Turnout | 1,025 | ||||
| Reform gain from Labour | Swing | ||||
| Party | Candidate | Votes | % | ±% | |
|---|---|---|---|---|---|
| Conservative | Andrew Prince | 589 | 44.4 | ||
| Green | Deena Draycott | 447 | 33.7 | ||
| Labour | Richard Pollard | 290 | 21.9 | ||
| Majority | 142 | 10.7 | |||
| Turnout | 1,326 | ||||
| Conservative gain from Labour | Swing | ||||
| Party | Candidate | Votes | % | ±% | |
|---|---|---|---|---|---|
| Conservative | Lorna Maginnis | 543 | 45.0 | ||
| Labour | Denise Mellors | 392 | 32.5 | ||
| Green | Mell Catori | 273 | 22.6 | ||
| Majority | 151 | 12.5 | |||
| Turnout | 1,208 | ||||
| Conservative gain from Labour | Swing | ||||