| |||||||||||||||||||||||||||||||||||||||||||||||||||||||||||
17 of the 51 seats to Derby City Council 26 seats needed for a majority | |||||||||||||||||||||||||||||||||||||||||||||||||||||||||||
---|---|---|---|---|---|---|---|---|---|---|---|---|---|---|---|---|---|---|---|---|---|---|---|---|---|---|---|---|---|---|---|---|---|---|---|---|---|---|---|---|---|---|---|---|---|---|---|---|---|---|---|---|---|---|---|---|---|---|---|
| |||||||||||||||||||||||||||||||||||||||||||||||||||||||||||
![]() Map showing the results of contested wards in the 2015 Derby City Council elections. | |||||||||||||||||||||||||||||||||||||||||||||||||||||||||||
|
The 2015 Derby City Council election took place on 7 May 2015 to elect members of the Derby City Council in England. [3] It was held on the same day as other local elections. The Labour Party increased its majority on the council by gaining two seats.
Party | Seats | Gains | Losses | Net gain/loss | Seats % | Votes % | Votes | +/− | |
---|---|---|---|---|---|---|---|---|---|
Labour | 11 | 2 | 0 | ![]() | 64.7 | 37.2 | 40,309 | ![]() | |
Conservative | 5 | 0 | 0 | ![]() | 29.4 | 31.2 | 33,750 | ![]() | |
Liberal Democrats | 1 | 0 | 1 | ![]() | 5.9 | 12.0 | 13,042 | ![]() | |
UKIP | 0 | 0 | 0 | ![]() | 0.0 | 16.9 | 18,293 | New | |
Green | 0 | 0 | 0 | ![]() | 0.0 | 1.1 | 1,217 | ![]() | |
Independent | 0 | 0 | 1 | ![]() | 0.0 | 0.8 | 875 | ![]() | |
TUSC | 0 | 0 | 0 | ![]() | 0.0 | 0.6 | 643 | New | |
BNP | 0 | 0 | 0 | ![]() | 0.0 | 0.1 | 98 | ![]() | |
British Independents | 0 | 0 | 0 | ![]() | 0.0 | 0.1 | 60 | New | |
English Democrat | 0 | 0 | 0 | ![]() | 0.0 | 0.0 | 50 | New |
All comparisons in vote share are to the corresponding 2011 election.
Party | Candidate | Votes | % | |
---|---|---|---|---|
Labour | Asaf Afzal | 2,688 | 50.1% | |
Conservative | Edward James Packham | 1,056 | 19.7% | |
Liberal Democrats | Richard Hudson | 875 | 16.3% | |
UKIP | Martin Ashley Bardoe | 748 | 13.9% | |
Majority | 1,632 | 30.4% | ||
Turnout | 5,367 | 54.8% | ||
Labour hold |
Party | Candidate | Votes | % | |
---|---|---|---|---|
Conservative | Steve Hassall | 4,867 | 56.7% | |
Labour | Simon Peter Parkes | 1,835 | 21.4% | |
UKIP | Frank Leeming | 1,005 | 11.7% | |
Liberal Democrats | Deena Smith | 883 | 10.3% | |
Majority | 3,032 | 35.3% | ||
Turnout | 8,590 | 77.5% | ||
Conservative hold |
Party | Candidate | Votes | % | |
---|---|---|---|---|
Labour | Paul Bayliss | 2,588 | 40.8% | |
UKIP | Arron Marsden | 1,826 | 28.8% | |
Conservative | Pete Berry | 1,404 | 22.4% | |
Liberal Democrats | Ellen Anthony | 385 | 6.1% | |
TUSC | Charles Albert Taylor | 74 | 1.2% | |
British Independents | David Andrew Gale | 60 | 0.9% | |
Majority | 762 | 12.0% | ||
Turnout | 6,337 | 55.9% | ||
Labour hold |
Party | Candidate | Votes | % | |
---|---|---|---|---|
Labour | Fareed Hussain | 3,549 | 71.1% | |
Conservative | Ross McCristal | 505 | 10.1% | |
Liberal Democrats | Margaret Hird | 434 | 8.7% | |
UKIP | Usman Khalid-Raja | 387 | 7.8% | |
TUSC | Graham Lewis | 118 | 2.4% | |
Majority | 3,044 | 61.0% | ||
Turnout | 4,993 | 46.3% | ||
Labour hold |
Party | Candidate | Votes | % | |
---|---|---|---|---|
Labour | Amo Raju | 2,401 | 36.8% | |
Liberal Democrats | Danielle Lind | 1,990 | 30.5% | |
Conservative | Max Craven | 1,235 | 18.9% | |
UKIP | Vincent Davis | 844 | 12.9% | |
Majority | 411 | 6.3% | ||
Turnout | 6,527 | 66.0% | ||
Labour gain from Liberal Democrats |
Party | Candidate | Votes | % | |
---|---|---|---|---|
Labour | Barbara Sybil Jackson | 2,177 | 37.8% | |
UKIP | Steve Fowke | 1,562 | 27.1% | |
Conservative | Celia Ingall | 1,538 | 26.7% | |
Green | David Leonard Foster | 239 | 4.2% | |
Liberal Democrats | Brian Venn | 159 | 2.8% | |
TUSC | Shaun Christopher Stuart | 80 | 1.4% | |
Majority | 615 | 10.7% | ||
Turnout | 5,755 | 57.8% | ||
Labour hold |
Party | Candidate | Votes | % | |
---|---|---|---|---|
Labour | Linda Mary Winter | 2,147 | 34.4% | |
Conservative | Jonathan Charles Smale | 2,131 | 34.2% | |
UKIP | Anthony Joseph Crawley | 1,558 | 25.0% | |
Liberal Democrats | Ian Colin Care | 304 | 4.9% | |
BNP | Paul Hillard | 98 | 1.6% | |
Majority | 16 | 0.3% | ||
Turnout | 6,238 | 62.0% | ||
Labour hold |
Party | Candidate | Votes | % | |
---|---|---|---|---|
Conservative | Alan Leslie Grimadell | 3,342 | 43.8% | |
Labour | Cecile Yvonne Wright | 2,161 | 28.3% | |
UKIP | John Evans | 1,506 | 19.7% | |
Liberal Democrats | Jane Elizabeth Katharine Webb | 568 | 7.4% | |
English Democrat | David William Black | 50 | 0.7% | |
Majority | 1,181 | 15.5% | ||
Turnout | 7,627 | 67.0% | ||
Conservative hold |
Party | Candidate | Votes | % | |
---|---|---|---|---|
Labour | Martin Jeffrey Repton | 2,698 | 39.1% | |
Conservative | Jordan Kemp | 2,373 | 34.4% | |
UKIP | Kirk Lewis Kus | 632 | 9.2% | |
Green | Alice Sarah Mason-Power | 632 | 9.2% | |
Liberal Democrats | John Allman Cameron | 565 | 8.2% | |
Majority | 325 | 4.7% | ||
Turnout | 6,900 | 66.4% | ||
Labour hold |
Party | Candidate | Votes | % | |
---|---|---|---|---|
Labour | Martin Rawson | 2,107 | 42.5% | |
UKIP | Sarah Ann Hallam | 1,336 | 27.0% | |
Conservative | Steve Willoughby | 1,165 | 23.5% | |
Liberal Democrats | Simon Ferrigno | 349 | 7.0% | |
Majority | 771 | 15.5% | ||
Turnout | 4,957 | 51.4% | ||
Labour hold |
Party | Candidate | Votes | % | |
---|---|---|---|---|
Liberal Democrats | Mike Carr | 2,682 | 35.4% | |
Labour | Dom Anderson | 2,403 | 31.7% | |
Conservative | Gee Afsar | 1,744 | 23.0% | |
UKIP | Vaughan Saxby | 606 | 8.0% | |
Independent (politician) | Tony Welch | 139 | 1.8% | |
Majority | 279 | 3.7% | ||
Turnout | 7,574 | 71.9% | ||
Liberal Democrats hold |
Party | Candidate | Votes | % | |
---|---|---|---|---|
Labour | Diane Elizabeth Froggatt | 1,811 | 32.9% | |
Conservative | Sean Thomas Rose | 1,268 | 23.0% | |
UKIP | Freddie Theobald | 1,094 | 19.9% | |
Independent | Lisa Maria Higginbottom* | 736 | 13.4% | |
Green | Marten Kats | 346 | 6.3% | |
Liberal Democrats | Catrin Sian Rutland | 250 | 4.5% | |
Majority | 543 | 9.9% | ||
Turnout | 5,505 | 57.4% | ||
Labour gain from Independent |
Note: Lisa Higginbottom was elected as a Labour councillor at the previous election in 2011, but resigned to sit as an independent in October 2013. [4]
Party | Candidate | Votes | % | |
---|---|---|---|---|
Conservative | John Keith | 3,772 | 43.9% | |
Liberal Democrats | Peter Joseph Barker | 2,382 | 27.7% | |
Labour | Lester John Pendrey | 1,523 | 17.7% | |
UKIP | Ian Edward Crompton | 925 | 10.8% | |
Majority | 1,390 | 16.2% | ||
Turnout | 8,602 | 73.6% | ||
Conservative hold |
Party | Candidate | Votes | % | |
---|---|---|---|---|
Labour | Jangir Khan | 3,763 | 71.6% | |
Conservative | Ashley Anthony Waterhouse | 597 | 11.4% | |
UKIP | Jayprakash Joshi | 486 | 9.2% | |
Liberal Democrats | Jill Leonard | 219 | 4.2% | |
TUSC | Terence Anderson | 191 | 3.6% | |
Majority | 3,166 | 60.2% | ||
Turnout | 5,256 | 51.0% | ||
Labour hold |
Party | Candidate | Votes | % | |
---|---|---|---|---|
Conservative | Robin Wood | 3,345 | 51.0% | |
Labour | Fay Knight | 1,672 | 25.5% | |
UKIP | Gary John Small | 1,197 | 18.3% | |
Liberal Democrats | Roger Anthony Jackson | 340 | 5.2% | |
Majority | 1,673 | 25.5% | ||
Turnout | 6,554 | 65.1% | ||
Conservative hold |
Party | Candidate | Votes | % | |
---|---|---|---|---|
Labour | Joanna Terese West | 2,993 | 60.7% | |
UKIP | Gaurav Pandey | 1,383 | 28.0% | |
Liberal Democrats | Jake Zyla | 432 | 8.8% | |
TUSC | Zbigniew Wojcik | 123 | 2.5% | |
Majority | 1,610 | 32.7% | ||
Turnout | 6,624 | 66.5% | ||
Labour hold |
Party | Candidate | Votes | % | |
---|---|---|---|---|
Conservative | Nicola Angela Roulstone | 3,384 | 51.1% | |
Labour | Richard Morgan | 1,793 | 27.1% | |
UKIP | Garth Munton | 1,222 | 18.4% | |
Liberal Democrats | Alf Wall | 225 | 3.4% | |
Majority | 1,591 | 24.0% | ||
Turnout | 6,624 | 66.5% | ||
Conservative hold |
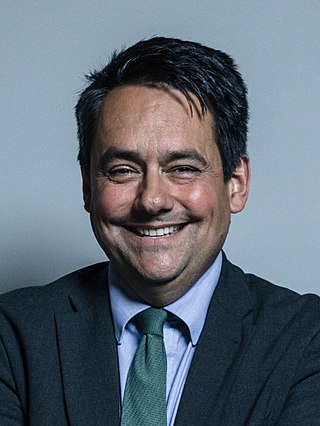
Stephen Daniel Twigg is a British Labour Co-op politician who has served as the 8th Secretary-General of the Commonwealth Parliamentary Association since August 2020. He served as Member of Parliament for Enfield Southgate from 1997 to 2005, and for Liverpool West Derby from 2010 to 2019.
Liverpool, West Derby is a constituency represented in the House of Commons of the UK Parliament since 2019 by Ian Byrne of the Labour Party. On 23 July 2024, Byrne was suspended from the Labour Party and had the whip withdrawn for six months, for voting to scrap the two child benefit cap. He now sits as an Independent.
Ribble Valley is a constituency in Lancashire represented in the House of Commons of the UK Parliament since 2024 by Maya Ellis, of the Labour Party.
Liverpool Walton is a constituency represented in the House of Commons of the UK Parliament since 2017 by Dan Carden of the Labour Party. Carden won the highest percentage share of the vote in June 2017 of 650 constituencies, 85.7%.
Derby North is a constituency formed of part of the city of Derby, represented in the House of Commons of the UK Parliament since 2024 by Catherine Atkinson from the Labour Party. It was previously held by Amanda Solloway, a Conservative.
Derby South is a constituency formed of part of the city of Derby, most recently represented in the House of Commons of the UK Parliament since 2024 by Baggy Shanker of the Labour and Co-op Party. Previous MP, Margaret Beckett, served the constituency for 41 years. She served under the Labour governments of Harold Wilson, James Callaghan, Tony Blair and Gordon Brown. She became interim Leader of the Labour Party in 1994 when John Smith suddenly died. She also served in the Opposition front bench under Neil Kinnock and Smith himself.
Derby City Council elections are held every four years to elect members of Derby City Council, the local authority for the unitary authority of Derby in Derbyshire, England. Since the last boundary changes in 2023, 51 councillors have been elected from 18 wards. Prior to 2023 elections were held three years out of every four, with a third of the council elected each time.
Derbyshire County Council is the upper-tier local authority for the non-metropolitan county of Derbyshire in England. The non-metropolitan county is smaller than the ceremonial county, which additionally includes Derby. The county council is based at County Hall in Matlock. Since 2017 the council has been under Conservative majority control. The council is a constituent member of the East Midlands Combined County Authority.
Derby City Council is the local authority for the city of Derby, in the ceremonial county of Derbyshire in the East Midlands region of England. Derby has had a council from medieval times, which has been reformed on numerous occasions. Since 1997 the council has been a unitary authority, being a district council which also performs the functions of a county council. Since 2024 the council has been a member of the East Midlands Combined County Authority.
The 1999 Derby City Council election took place on 6 May 1999 to elect members of Derby City Council in England. One third of the council was up for election and the Labour party kept overall control of the council. Overall turnout was 29.0%.
The 2004 Derby City Council election took place on 10 June 2004 to elect members of Derby City Council in England. One third of the council was up for election and the council stayed under no overall control.
The 2007 Derby City Council election took place on 3 May 2007 to elect members of Derby City Council in England. One third of the council was up for election and the council stayed under no overall control.
Knotty Ash ward was an electoral division of Liverpool City Council centred on the Knotty Ash district of Liverpool.
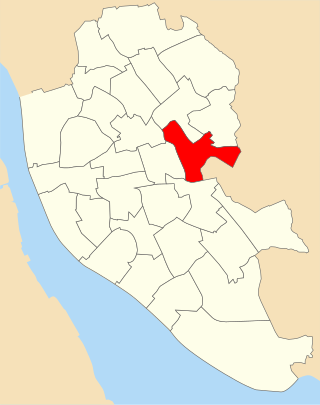
Everton ward was an electoral division of Liverpool City Council in the Liverpool Walton Parliamentary constituency.
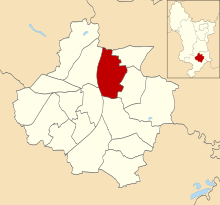
Croxteth ward is an electoral division of Liverpool City Council. The ward is in the Liverpool West Derby parliamentary constituency.
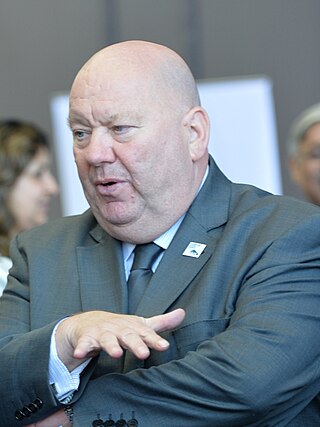
From 2012 to 2023, the mayor of Liverpool was the executive mayor of the city of Liverpool in England. The office was abolished in 2023 and its functions were replaced with the leader of Liverpool City Council.
The 2015 City of Bradford Metropolitan District Council election took place on 7 May 2015. This was on the same day as other local elections and a general election. One councillor was elected in each ward for a four-year term so the councillors elected in 2015 last stood for election in 2011. Each ward is represented by three councillors, the election of which is staggered, so only one third of the councillors were elected in this election. Labour retained overall control of the council.
The 2015 Leeds City Council election took place on Thursday 7 May 2015 to elect members of Leeds City Council in England. It was held on the same day as the 2015 general election and other local elections across the UK.
The 2015 Plymouth City Council election took place on 7 May 2015 to elect members of Plymouth City Council in England.
The 2016 Liverpool City Council election took place on 5 May 2016 to elect members of Liverpool City Council in England. This was on the same day as the election for the Elected Mayor of Liverpool and the Police and Crime Commissioner for Merseyside.