| |||||||||||||||||||||||||||||||||
15 of 45 seats for Amber Valley Borough Council 23 seats needed for a majority | |||||||||||||||||||||||||||||||||
---|---|---|---|---|---|---|---|---|---|---|---|---|---|---|---|---|---|---|---|---|---|---|---|---|---|---|---|---|---|---|---|---|---|
| |||||||||||||||||||||||||||||||||
Results of the 2022 Amber Valley Borough Council election by ward |
The elections to Amber Valley Borough Council in Derbyshire, England took place on Thursday 5th May 2022. One third of the council were up for election. The Conservatives increased their majority on the council whilst the Green Party also gained seats.
This election was the last by thirds election and the last before boundary changes proposed by the Local Government Boundary Commission came into effect at the 2023 election. [1] Councillors elected this year served for a period of one year.
2022 Amber Valley Borough Council Election [2] | ||||||||||
---|---|---|---|---|---|---|---|---|---|---|
Party | This election | Full council | This election | |||||||
Seats | Net | Seats % | Other | Total | Total % | Votes | Votes % | +/− | ||
Conservative | 9 | 2 | 60.0 | 21 | 30 | 66.7 | 10,236 | 42.6 | -11.0 | |
Labour | 4 | 4 | 26.7 | 7 | 11 | 24.4 | 8,744 | 36.4 | +0.9 | |
Green | 2 | 2 | 13.3 | 1 | 3 | 6.7 | 3,916 | 16.3 | +8.7 | |
Liberal Democrats | 0 | 0.0 | 0 | 0 | 0.0 | 1,076 | 4.5 | +1.2 | ||
National Front | 0 | 0.0 | 0 | 0 | 0.0 | 28 | 0.0 | ±0.0 | ||
SDP | 0 | 0.0 | 0 | 0 | 0.0 | 21 | 0.0 | ±0.0 |
Following the last election in 2021, the composition of the council was:
28 | 16 | 1 |
Conservative | Labour | Grn |
After the election, the composition of the council was:
30 | 11 | 3 | 1 |
Conservative | Labour | Green | Ind |
Independent caused by Neil Ploughman for Belper Central leaving The Labour Party in 2021
Percentage change is from the 2018 Amber Valley Borough Council Election.
Party | Candidate | Votes | % | ±% | |
---|---|---|---|---|---|
Labour | Steve Marshall-Clarke | 852 | 50.5 | 8.9 | |
Conservative | Jonty Powis | 629 | 37.3 | 4.1 | |
Liberal Democrats | Paul Robin Gibbons | 106 | 6.3 | 3.4 | |
Green | Russ Hubber | 100 | 5.9 | 1.4 | |
Majority | 223 | 13.2 | |||
Turnout | 1,687 | 25 | |||
Labour hold | Swing | ||||
Party | Candidate | Votes | % | ±% | |
---|---|---|---|---|---|
Labour | Fay Atkinson | 758 | 45.4 | 0.5 | |
Conservative | Mark Edward Robertson | 589 | 35.3 | 6.3 | |
Green | Kendal Greaves | 172 | 10.3 | 5.9 | |
Liberal Democrats | James Morrissey | 150 | 9.0 | 0.1 | |
Majority | 169 | 10.1 | |||
Turnout | 1,669 | 36 | |||
Labour hold | Swing | ||||
Party | Candidate | Votes | % | ±% | |
---|---|---|---|---|---|
Green | Jamie Alexander Walls | 973 | 54.9 | 47.3 | |
Conservative | Daniel James Kerry | 385 | 21.7 | 15.3 | |
Labour | Joel Martin Bryan | 381 | 21.5 | 26.2 | |
Liberal Democrats | Richard Alan Salmon | 34 | 1.9 | 1.6 | |
Majority | 588 | 33.2 | |||
Turnout | 1,773 | 41 | |||
Green gain from Labour | Swing | ||||
Party | Candidate | Votes | % | ±% | |
---|---|---|---|---|---|
Labour | Christopher Emmas-Williams | 681 | 51.8 | 0.6 | |
Conservative | Mark Neil O'Malley | 524 | 39.8 | 5.9 | |
Green | David Martin Hatchett | 72 | 5.5 | 5.5 | |
Liberal Democrats | Jeremy Quentin Miles | 38 | 2.9 | 0.3 | |
Majority | 157 | 12.0 | |||
Turnout | 1,315 | 33 | |||
Labour hold | Swing | ||||
Party | Candidate | Votes | % | ±% | |
---|---|---|---|---|---|
Green | Alison Jane McDermott | 1,474 | 69.8 | 35.7 | |
Conservative | Pippa Rowen | 508 | 24.1 | 23.9 | |
Labour | Mark Spilsbury | 102 | 4.8 | 7.2 | |
Liberal Democrats | Sue Allen | 28 | 1.3 | 4.6 | |
Majority | 966 | 45.7 | |||
Turnout | 2,112 | 54 | |||
Green gain from Conservative | Swing | ||||
Party | Candidate | Votes | % | ±% | |
---|---|---|---|---|---|
Conservative | Nikki Savage | 560 | 49.8 | 4.3 | |
Labour | Kieran James Denbygh Hill | 435 | 38.7 | 9.3 | |
Green | James Major John Brooks | 77 | 6.9 | 2.5 | |
Liberal Democrats | Kate Smith | 52 | 4.6 | 2.5 | |
Majority | 125 | 11.1 | |||
Turnout | 1,124 | 28 | |||
Conservative gain from Labour | Swing | ||||
Party | Candidate | Votes | % | ±% | |
---|---|---|---|---|---|
Conservative | Henry William Thompson | 669 | 52.3 | 2.5 | |
Labour | Janet Irene Ward | 451 | 35.2 | 8.2 | |
Green | Cathie Hallsworth | 105 | 8.2 | 8.2 | |
Liberal Democrats | Jerry Marler | 55 | 4.3 | 2.5 | |
Majority | 218 | 17.1 | |||
Turnout | 1,280 | 28 | |||
Conservative hold | Swing | ||||
Party | Candidate | Votes | % | ±% | |
---|---|---|---|---|---|
Conservative | Steven Grainger | 658 | 48.2 | 1.5 | |
Labour | Steve Bower | 556 | 40.7 | 4.1 | |
Green | Tina Pritchard | 90 | 6.6 | 1.4 | |
Liberal Democrats | Michael John Heap | 61 | 4.5 | 1.2 | |
Majority | 102 | 7.5 | |||
Turnout | 1,365 | 28 | |||
Conservative hold | Swing | ||||
Party | Candidate | Votes | % | ±% | |
---|---|---|---|---|---|
Conservative | Pete Clark | 707 | 47.1 | 5.4 | |
Labour | Paul Christopher Wardle | 648 | 43.2 | 11.2 | |
Green | Rachael Hatchett | 96 | 6.4 | 6.4 | |
Liberal Democrats | Kate Mary Kift | 50 | 3.3 | 0.6 | |
Majority | 59 | 3.9 | |||
Turnout | 1,501 | 32 | |||
Conservative gain from Labour | Swing | ||||
Party | Candidate | Votes | % | ±% | |
---|---|---|---|---|---|
Conservative | Trevor Mark Ainsworth | 1,163 | 50.9 | 6.5 | |
Labour | Keith Lisle Venables | 763 | 33.4 | 0.1 | |
Green | Cathy Kinsella | 267 | 11.7 | 7.5 | |
Liberal Democrats | Chris Gent | 92 | 4.0 | 0.8 | |
Majority | 400 | 17.5 | |||
Turnout | 2,285 | 37 | |||
Conservative hold | Swing | ||||
Party | Candidate | Votes | % | ±% | |
---|---|---|---|---|---|
Conservative | Sheena Edith Trower | 530 | 49.9 | 5.5 | |
Labour | Eileen Hamilton | 450 | 42.3 | 6.4 | |
Liberal Democrats | Joanna Elizabeth Karpasea | 55 | 5.2 | 1.1 | |
National Front | Timothy Knowles | 28 | 2.6 | 0.1 | |
Majority | 80 | 3.3 | |||
Turnout | 1,063 | 25 | |||
Conservative gain from Labour | Swing | ||||
Party | Candidate | Votes | % | ±% | |
---|---|---|---|---|---|
Conservative | Sean David Carter | 1,065 | 45.7 | 3.9 | |
Labour | Tony Holmes | 987 | 42.4 | 1.2 | |
Green | Michael Peter Bedford | 147 | 6.7 | 3.6 | |
Liberal Democrats | Richard William Smeeton | 99 | 4.3 | 0.6 | |
SDP | Edwin George Dale Taylor | 21 | 0.9 | 0.9 | |
Majority | 78 | 3.3 | |||
Turnout | 2,319 | 33 | |||
Conservative hold | Swing | ||||
Party | Candidate | Votes | % | ±% | |
---|---|---|---|---|---|
Conservative | Richard Henry Iliffe | 1,010 | 55.7 | 8.6 | |
Labour | Amina Sabeah Deen Burslem | 483 | 26.6 | 2.7 | |
Green | Lian Pizzey | 213 | 11.7 | 6.4 | |
Liberal Democrats | Adrian James Miller | 108 | 6.0 | 0.4 | |
Majority | 552 | 29.1 | |||
Turnout | 1,814 | 36 | |||
Conservative hold | Swing | ||||
Party | Candidate | Votes | % | ±% | |
---|---|---|---|---|---|
Labour | Katie Simpson | 682 | 59.8 | 6.8 | |
Conservative | Paul Price | 407 | 35.7 | 5.5 | |
Liberal Democrats | Paul Slater | 51 | 4.5 | 1.4 | |
Majority | 275 | 24.1 | |||
Turnout | 1,140 | 25 | |||
Labour hold | Swing | ||||
Party | Candidate | Votes | % | ±% | |
---|---|---|---|---|---|
Conservative | David Wilson | 832 | 52.9 | 6.7 | |
Labour | Matt Allwood | 515 | 32.7 | 5.8 | |
Green | Steve Elliott | 130 | 8.3 | 1.8 | |
Liberal Democrats | Malvin Leslie Trigg | 97 | 6.2 | 0.8 | |
Majority | 317 | 20.2 | |||
Turnout | 1,574 | 37 | |||
Conservative hold | Swing | ||||
Amber Valley Borough Council elections are generally held three years out of every four, with a third of the council elected each time. Amber Valley Borough Council is the local authority for the non-metropolitan district of Amber Valley in Derbyshire, England. Since the last boundary changes in 2000, 45 councillors have been elected to represent 23 wards. New ward boundaries are due to come into force from the 2023 elections.
Liverpool City Council elections will be held every four years from 2023. Between 1973 and 2021 elections were generally held three years out of every four, with a third of the council being elected each time. Liverpool City Council is the local authority for the metropolitan borough of Liverpool in Merseyside, England. Since the last boundary changes in 2004, 90 councillors have been elected from 30 wards. New ward boundaries are being prepared to take effect from the 2023 election.
Stockport Metropolitan Borough Council elections are generally held three years out of every four, with a third of the council being elected each time. Stockport Metropolitan Borough Council is the local authority for the metropolitan borough of Metropolitan Borough of Stockport in Greater Manchester, England. Since the last boundary changes in 2004, 63 councillors have been elected from 21 wards. New ward boundaries are being prepared to take effect from the 2023 election.
Trafford Metropolitan Borough Council elections are generally held three years out of every four, with a third of the council being elected each time. Trafford Metropolitan Borough Council, generally known as Trafford Council, is the local authority for the metropolitan borough of Trafford in Greater Manchester, England. Since the last boundary changes in 2004, 63 councillors have been elected from 21 wards. New ward boundaries are being prepared to take effect from the 2023 election.
One third of Basildon Borough Council in Essex, England is elected each year, followed by one year without election. Since the last boundary changes in 2002, 42 councillors have been elected from 16 wards.
Oldham Metropolitan Borough Council elections are generally held three years out of every four, with a third of the council being elected each time. Oldham Metropolitan Borough Council, generally known as Oldham Council, is the local authority for the metropolitan borough of Oldham in Greater Manchester, England. Since the last boundary changes in 2004, 60 councillors have been elected from 20 wards. New ward boundaries are due to come into effect from the 2023 election.
Elections to Maidstone Borough Council in Kent, United Kingdom are held each year to elect one-third of its members, followed by one year without election. Since the last boundary changes in 2002, 55 councillors have been elected from 26 wards. From 2023 onwards, the format of elections will change, with all 55 councillors being elected once every 4 years.
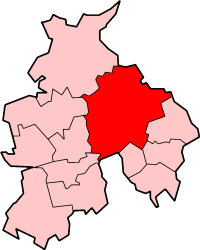
Ribble Valley Borough Council elections are held every four years. Ribble Valley Borough Council is the local authority for the non-metropolitan district of Ribble Valley in Lancashire, England. Since the last boundary changes in 2019, 39 councillors have been elected from 26 wards.
This article documents the strengths of political parties in the 333 local authorities of England, 32 local authorities of Scotland, 22 principal councils of Wales and 11 local councils of Northern Ireland.
Local elections were held in the United Kingdom in 1980. These were the first annual local elections for the new Conservative Prime Minister Margaret Thatcher. Though the Conservatives in government lost seats, the projected share of the vote was close: Labour Party 42%, Conservative Party 40%, Liberal Party 13%. Labour were still being led by the former prime minister James Callaghan, who resigned later in the year to be succeeded by Michael Foot.
Milton Keynes City Council is the local authority for the City of Milton Keynes, a unitary authority in Buckinghamshire, England. Until 1 April 1997 it was a non-metropolitan district.
The 2011 Amber Valley Borough Council election took place on 5 May 2011 to elect members of Amber Valley Borough Council in Derbyshire, England. One third of the council was up for election and the Conservative Party stayed in overall control of the council.
Elections to Amber Valley Borough Council in Derbyshire, England took place on Thursday 5 May 2016. One third of the council seats were up for election and after the election the Conservative Party continued to hold overall control of the council.
Local elections in the United Kingdom took place on 5 May 2022. These included elections for all London borough councils, for all local authorities in Wales and Scotland. Most seats in England were last up for election in 2018 and in Scotland and Wales in 2017. The elections coincided with the 2022 Northern Ireland Assembly election. In 91 cases, most of them in Wales, council seats were uncontested, each having only one candidate. Three seats in Scotland remained unfilled as no one nominated to fill them.
The 2021 elections to Amber Valley Borough Council were held on Wednesday 5th May 2021, 16 seats in the council were up for election. The Conservative Party retook control of the council from The Labour Party after losing control in 2019. These seats were due to have been contested in 2020, but the elections were delayed by a year due to the COVID-19 pandemic along with other elections.
The 2022 Barking and Dagenham London Borough Council election took place on 5 May 2022. All 51 members of Barking and Dagenham London Borough Council were elected. The elections took place alongside local elections in the other London boroughs and elections to local authorities across the United Kingdom.
The 2022 Bromley London Borough Council election took place on 5 May 2022. All 58 members of Bromley London Borough Council were elected. The elections took place alongside local elections in the other London boroughs and elections to local authorities across the United Kingdom.
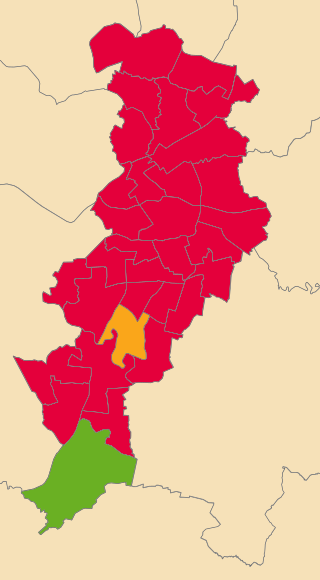
The 2022 Manchester City Council election took place on 5 May 2022. One third of councillors on Manchester City Council were elected. This election was a part of the other local elections across the United Kingdom.
Local elections are scheduled to be held in the United Kingdom in May 2023. Elections in England are scheduled to be held on 4 May, with the Northern Irish election scheduled to be held on 18 May. These will include district councils, unitary authorities, and directly-elected mayors in England, and all local councils in Northern Ireland.
The 2023 Amber Valley Borough Council election will be held on 4 May 2023 to elect all 42 councillors for Amber Valley Borough Council. This will be on the same day as other local elections.