
The 2011 Bolsover District Council election took place on 5 May 2011 to elect members of Bolsover District Council in Derbyshire, England. The whole council was up for election and the Labour party stayed in overall control of the council. [1]

The 2011 Bolsover District Council election took place on 5 May 2011 to elect members of Bolsover District Council in Derbyshire, England. The whole council was up for election and the Labour party stayed in overall control of the council. [1]
| Party | Seats | Gains | Losses | Net gain/loss | Seats % | Votes % | Votes | +/− | |
|---|---|---|---|---|---|---|---|---|---|
| Labour | 31 | 4 | 0 | +4 | 83.8 | 64.5 | 23,712 | +3.7% | |
| Independent | 4 | 0 | 3 | -3 | 10.8 | 14.4 | 5,310 | -9.1% | |
| Whitwell Residents Association | 1 | 0 | 1 | -1 | 2.7 | 2.1 | 778 | -3.2% | |
| Green | 1 | 1 | 0 | +1 | 2.7 | 1.2 | 453 | +0.0% | |
| Conservative | 0 | 0 | 0 | 0 | 0 | 11.9 | 4,381 | +11.9% | |
| BNP | 0 | 0 | 0 | 0 | 0 | 3.1 | 1,123 | +1.1% | |
| Barlborough First | 0 | 0 | 0 | 0 | 0 | 1.2 | 423 | -3.3% | |
| TUSC | 0 | 0 | 1 | -1 | 0 | 0.9 | 346 | +0.9% | |
| Liberal Democrats | 0 | 0 | 0 | 0 | 0 | 0.7 | 247 | -0.6% | |
| Party | Candidate | Votes | % | ±% | |
|---|---|---|---|---|---|
| Labour | Eion Watts | 690 | |||
| Labour | Hilary Gilmour | 588 | |||
| Barlborough First | John Shaw | 423 | |||
| Conservative | Klara Jeynes | 286 | |||
| Turnout | 1,987 | 46.0 | |||
| Labour hold | Swing | ||||
| Labour hold | Swing | ||||
| Party | Candidate | Votes | % | ±% | |
|---|---|---|---|---|---|
| Labour | Alan Tomlinson | 777 | |||
| Labour | Clare Munks | 638 | |||
| Independent | Dexter Bullock | 435 | |||
| Conservative | Suzanne Harkins | 278 | |||
| Liberal Democrats | Ian Cox | 247 | |||
| Independent | Paula Wilkinson | 226 | |||
| Independent | Leonard Walker | 104 | |||
| Turnout | 2,705 | 44.5 | |||
| Labour hold | Swing | ||||
| Labour gain from Independent | Swing | ||||
| Party | Candidate | Votes | % | ±% | |
|---|---|---|---|---|---|
| Labour | Paul Cooper | 561 | |||
| Labour | Thomas Rodda | 528 | |||
| Conservative | Ann Marshall | 277 | |||
| Turnout | 1,366 | 31.6 | |||
| Labour hold | Swing | ||||
| Labour hold | Swing | ||||
| Party | Candidate | Votes | % | ±% | |
|---|---|---|---|---|---|
| Labour | Jennie Bennett | 787 | |||
| Labour | James Hall | 611 | |||
| Conservative | Nicholas Gray-Cowley | 351 | |||
| Turnout | 1,749 | 59.1 | |||
| Labour hold | Swing | ||||
| Labour hold | Swing | ||||
| Party | Candidate | Votes | % | ±% | |
|---|---|---|---|---|---|
| Labour | Keith Bowman | 661 | |||
| Labour | Rosemary Bowler | 628 | |||
| Conservative | Maxine Hunt | 222 | |||
| TUSC | Jonathan Dale | 174 | |||
| Turnout | 1,685 | 36.9 | |||
| Labour hold | Swing | ||||
| Labour hold | Swing | ||||
| Party | Candidate | Votes | % | ±% | |
|---|---|---|---|---|---|
| Labour | Brian Hendry | 611 | |||
| Labour | Terence Connerton | 544 | |||
| Independent | Paul Hendry | 262 | |||
| Conservative | Malcolm Rowley | 217 | |||
| Turnout | 1,634 | 33.1 | |||
| Labour gain from Independent | Swing | ||||
| Labour hold | Swing | ||||
| Party | Candidate | Votes | % | ±% | |
|---|---|---|---|---|---|
| Labour | James Smith | 655 | |||
| Labour | Karl Reid | 600 | |||
| Independent | Allan Bailey | 454 | |||
| Conservative | Natasha Gray-Cowley | 250 | |||
| Turnout | 1,959 | 40.8 | |||
| Labour hold | Swing | ||||
| Labour gain from Independent | Swing | ||||
| Party | Candidate | Votes | % | ±% | |
|---|---|---|---|---|---|
| Labour | Duncan McGregor | 1,211 | |||
| Labour | Rita Turner | 1,059 | |||
| Independent | James Clifton | 972 | |||
| Labour | Paul Colbert | 921 | |||
| Conservative | Derek Stiff | 258 | |||
| Turnout | 4,421 | 41.4 | |||
| Labour hold | Swing | ||||
| Labour hold | Swing | ||||
| Independent hold | Swing | ||||
| Party | Candidate | Votes | % | ±% | |
|---|---|---|---|---|---|
| Labour | Mary Dooley | 658 | |||
| Labour | Dennis Kelly | 608 | |||
| Independent | John Meredith | 330 | |||
| Independent | Cherry Drake-Brockman | 210 | |||
| Conservative | Kristie Matthewman-Know | 178 | |||
| Turnout | 1,984 | 33.7 | |||
| Labour hold | Swing | ||||
| Labour hold | Swing | ||||
| Party | Candidate | Votes | % | ±% | |
|---|---|---|---|---|---|
| Labour | Pauline Bowmer | 828 | |||
| Labour | Ann Syrett | 615 | |||
| Conservative | Stephen Matthewman-Know | 401 | |||
| Turnout | 1,844 | 42.6 | |||
| Labour hold | Swing | ||||
| Labour hold | Swing | ||||
| Party | Candidate | Votes | % | ±% | |
|---|---|---|---|---|---|
| Labour | Jennfer Wilson | 803 | |||
| Labour | Malcolm Crane | 711 | |||
| Conservative | Nicholas Sternberg | 297 | |||
| BNP | Martin Radford | 237 | |||
| BNP | Nigel Poynton | 185 | |||
| Turnout | 2,233 | 42.2 | |||
| Labour hold | Swing | ||||
| Labour hold | Swing | ||||
| Party | Candidate | Votes | % | ±% | |
|---|---|---|---|---|---|
| Labour | Brian Murray-Carr | 332 | 72.0 | ||
| BNP | Gary Widdowson | 75 | 16.3 | ||
| Conservative | Mark McKeown | 54 | 11.7 | ||
| Majority | 257 | 55.7 | |||
| Turnout | 461 | 40.8 | |||
| Labour hold | Swing | ||||
| Party | Candidate | Votes | % | ±% | |
|---|---|---|---|---|---|
| Labour | Kenneth Walker | 571 | 80.6 | ||
| BNP | Lesley Redding | 137 | 19.4 | ||
| Majority | 434 | 61.3 | |||
| Turnout | 708 | 42.3 | |||
| Labour hold | Swing | ||||
| Party | Candidate | Votes | % | ±% | |
|---|---|---|---|---|---|
| Labour | Stephen Fritchley | 330 | 54.2 | +7.0 | |
| TUSC | Raymond Holmes | 172 | 28.2 | -24.6 | |
| BNP | Paul Harford | 107 | 17.6 | +17.6 | |
| Majority | 158 | 25.9 | |||
| Turnout | 609 | 30.0 | |||
| Labour gain from TUSC | Swing | ||||
| Party | Candidate | Votes | % | ±% | |
|---|---|---|---|---|---|
| Labour | Andrew Anderson | 402 | 65.5 | ||
| BNP | Nigel Shipman | 132 | 21.5 | ||
| Conservative | Aidan Press | 80 | 13.0 | ||
| Majority | 270 | 44.0 | |||
| Turnout | 614 | 40.2 | |||
| Labour hold | Swing | ||||
| Party | Candidate | Votes | % | ±% | |
|---|---|---|---|---|---|
| Independent | Alan Waring | 403 | 52.1 | +2.0 | |
| Labour | Hazel Ward | 249 | 32.2 | -17.7 | |
| BNP | Alan Brown | 74 | 9.6 | +9.6 | |
| Conservative | Frederick Newholme | 47 | 6.1 | +6.1 | |
| Majority | 154 | 19.9 | +19.8 | ||
| Turnout | 773 | 40.3 | |||
| Independent hold | Swing | ||||
| Party | Candidate | Votes | % | ±% | |
|---|---|---|---|---|---|
| Labour | Terry Cook | 647 | |||
| Labour | John Phelan | 597 | |||
| Conservative | Claire Gratton | 248 | |||
| Conservative | Michael Holmes | 228 | |||
| BNP | Brian Edwards | 176 | |||
| Turnout | 1,896 | 32.4 | |||
| Labour hold | Swing | ||||
| Labour hold | Swing | ||||
| Party | Candidate | Votes | % | ±% | |
|---|---|---|---|---|---|
| Labour | Raymond Brooks | 906 | |||
| Labour | Susan Wallis | 824 | |||
| Labour | Graham Parkin | 765 | |||
| Conservative | Robert Sainsbury | 709 | |||
| Turnout | 3,204 | 35.2 | |||
| Labour hold | Swing | ||||
| Labour hold | Swing | ||||
| Labour hold | Swing | ||||
| Party | Candidate | Votes | % | ±% | |
|---|---|---|---|---|---|
| Independent | Raymond Heffer | 784 | |||
| Independent | Deborah Watson | 752 | |||
| Labour | Kathryn Salt | 620 | |||
| Labour | Anthony Trafford | 451 | |||
| Turnout | 2,607 | 40.7 | |||
| Independent hold | Swing | ||||
| Independent hold | Swing | ||||
| Party | Candidate | Votes | % | ±% | |
|---|---|---|---|---|---|
| Green | Duncan Kerr | 453 | |||
| Whitwell Residents Association | George Webster | 452 | |||
| Labour | Thomas Munro | 383 | |||
| Independent | Sandra Frow | 378 | |||
| Labour | Jeanne Raspin | 342 | |||
| Whitwell Residents Association | Vivienne Mills | 326 | |||
| Turnout | 2,334 | 41.4 | |||
| Green gain from Residents | Swing | ||||
| Residents hold | Swing | ||||
A by-election was held in Shirebrook South West on 25 August 2011 after the death of the independent councillor Alan Waring. [4] The seat was gained for the Labour party by Sandra Peake with a majority of 97 votes over the Green party. [4]
| Party | Candidate | Votes | % | ±% | |
|---|---|---|---|---|---|
| Labour | Sandra Peake | 200 | 47.8 | +15.6 | |
| Green | Ian Musgrove | 103 | 24.6 | +24.6 | |
| Conservative | Frederick Newholme | 72 | 17.2 | +11.1 | |
| BNP | David Key | 43 | 10.3 | +0.7 | |
| Majority | 97 | 23.2 | |||
| Turnout | 418 | ||||
| Labour gain from Independent | Swing | ||||
| Party | Candidate | Votes | % | ±% | |
|---|---|---|---|---|---|
| Whitwell Residents Association | Vivienne Mills | 347 | 57.5 | ||
| Labour | Frank Raspin | 256 | 42.5 | ||
| Majority | 91 | 15.1 | |||
| Turnout | 603 | ||||
| Residents gain from Green | Swing | ||||
A by-election was held in South Normanton East on 14 August 2014 after the death of Labour councillor Terry Cook. [6] The seat was held for Labour by Tracey Cannon with a majority of 173 votes over the Conservatives. [7]
| Party | Candidate | Votes | % | ±% | |
|---|---|---|---|---|---|
| Labour | Tracey Cannon | 293 | 70.9 | +10.5 | |
| Conservative | Robert Sainsbury | 120 | 29.1 | +5.9 | |
| Majority | 173 | 41.9 | |||
| Turnout | 413 | 12.5 | -19.9 | ||
| Labour hold | Swing | ||||
A by-election was held in Bolsover North West on 8 January 2015 after the death of Labour councillor Thomas Rodda. [8] The seat was held for Labour by Susan Statter with a majority of 21 votes over the UK Independence Party. [9]
| Party | Candidate | Votes | % | ±% | |
|---|---|---|---|---|---|
| Labour | Susan Statter | 174 | 45.0 | -22.0 | |
| UKIP | John Bagshaw | 153 | 39.5 | +39.5 | |
| Conservative | Maxine Hunt | 60 | 15.5 | -17.6 | |
| Majority | 21 | 5.4 | |||
| Turnout | 387 | 13.4 | -18.2 | ||
| Labour hold | Swing | ||||

Bolsover is a constituency in Derbyshire, represented in the House of Commons of the UK Parliament by Mark Fletcher, a member of the Conservative Party. The constituency was created in 1950, and is centred on the town of Bolsover.

Cornwall Council, known until 2009 as Cornwall County Council, is the unitary authority which governs the district of Cornwall, which covers the majority of the ceremonial county of the same name in the South West of England. The council has had a Conservative Party majority since the 2021 local elections. Its headquarters is Lys Kernow in Truro.
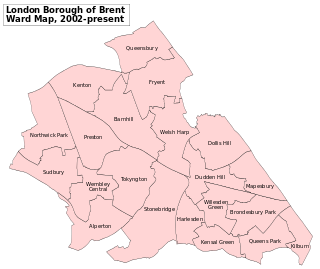
Brent London Borough Council in London, England is elected every four years. Since the last boundary changes in 2002, 63 councillors have been elected from 21 wards.

Bolsover District Council elections are held every four years. Bolsover District Council is the local authority for the non-metropolitan district of Bolsover in Derbyshire, England. Since the last boundary changes in 2019, 37 councillors have been elected from 17 wards.
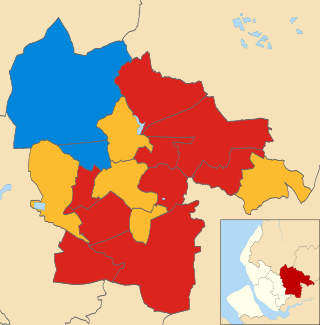
The 2008 St Helens Metropolitan Borough Council election took place on 1 May 2008 to elect members of St Helens Metropolitan Borough Council in Merseyside, England. One third of the council was up for election and the council stayed under no overall control.

The 2008 Wyre Forest District Council election took place on 1 May 2008 to elect members of Wyre Forest District Council in Worcestershire, England. One third of the council was up for election and the Conservative Party gained overall control of the council from no overall control.
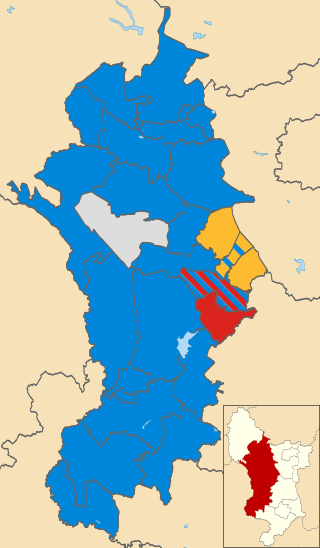
The 2007 Derbyshire Dales District Council election took place on 3 May 2007 to elect members of Derbyshire Dales District Council in Derbyshire, England. The whole council was up for election and the Conservative Party stayed in overall control of the council.

The 2011 Derbyshire Dales District Council election took place on 5 May 2011 to elect members of Derbyshire Dales District Council in Derbyshire, England. The whole council was up for election and the Conservative Party stayed in overall control of the council.

The 2011 Torridge District Council election took place on 5 May 2011 to elect members of Torridge District Council in Devon, England. The whole council was up for election and the council stayed under no overall control.

The 2012 Huntingdonshire District Council election took place on 3 May 2012 to elect members of Huntingdonshire District Council in Cambridgeshire, England. One third of the council was up for election and the Conservative Party stayed in overall control of the council.
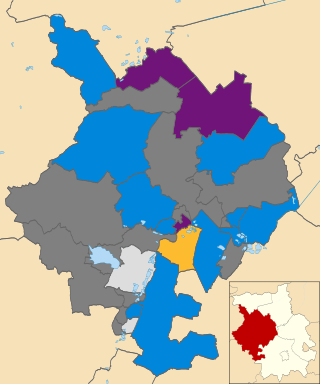
The 2014 Huntingdonshire District Council election took place on 22 May 2014 to elect members of Huntingdonshire District Council in Cambridgeshire, England. One third of the council was up for election and the Conservative Party stayed in overall control of the council.

The 2007 Bolsover District Council election took place on 3 May 2007 to elect members of Bolsover District Council in Derbyshire, England. The whole council was up for election and the Labour party stayed in overall control of the council.

The 2011 West Berkshire Council election took place on 5 May 2011 to elect members of West Berkshire Council in Berkshire, England. The whole council was up for election and the Conservative Party stayed in overall control of the council.
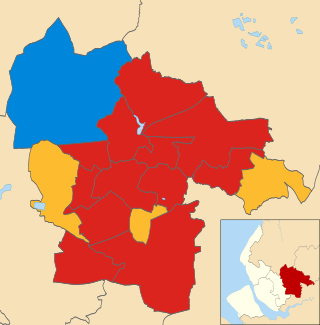
The 2010 St Helens Metropolitan Borough Council election took place on 6 May 2010 to elect members of St Helens Metropolitan Borough Council in Merseyside, England. One third of the council was up for election and the Labour Party gained overall control of the council from no overall control.

The 2012 St Helens Metropolitan Borough Council election took place on 3 May 2012 to elect members of St Helens Metropolitan Borough Council in Merseyside, England. One third of the council was up for election and the LabourPparty stayed in overall control of the council.

The 2012 Carlisle City Council election took place on 3 May 2012 to elect members of Carlisle District Council in Cumbria, England. One third of the council was up for election and the Labour Party gained overall control of the council from no overall control.

The 2014 Carlisle City Council election took place on 22 May 2014 to elect members of Carlisle District Council in Cumbria, England. One third of the council was up for election and the Labour Party stayed in overall control of the council.

The 2011 South Kesteven District Council election took place on 5 May 2011 to elect members of South Kesteven District Council in Lincolnshire, England. The whole council was up for election and the Conservative party stayed in overall control of the council.

The 2015 Wychavon District Council election took place on 7 May 2015 to elect members of Wychavon District Council in Worcestershire, England. The whole council was up for election and the Conservative Party stayed in overall control of the council.

The 2015 Rother District Council election took place on 7 May 2015 to elect members of Rother District Council in East Sussex, England. The whole council was up for election and the Conservative Party stayed in overall control of the council.