| ||||||||||||||||||||||||||||||||||||||||
All 30 seats to Lisburn City Council 16 seats needed for a majority | ||||||||||||||||||||||||||||||||||||||||
---|---|---|---|---|---|---|---|---|---|---|---|---|---|---|---|---|---|---|---|---|---|---|---|---|---|---|---|---|---|---|---|---|---|---|---|---|---|---|---|---|
| ||||||||||||||||||||||||||||||||||||||||
Party with the most votes by district. |
Elections to Lisburn City Council were held on 5 May 2011 on the same day as the other Northern Irish local government elections. The election used five district electoral areas to elect a total of 30 councillors.
Party | Seats | Gains | Losses | Net gain/loss | Seats % | Votes % | Votes | +/− | |
---|---|---|---|---|---|---|---|---|---|
DUP | 14 | 1 | 0 | 1 | 46.7 | 41.0 | 16,767 | 0.3 | |
Sinn Féin | 5 | 0 | 0 | 1 | 16.7 | 20.3 | 8,328 | 3.7 | |
UUP | 5 | 0 | 2 | 2 | 16.7 | 16.6 | 6,803 | 6.1 | |
Alliance | 3 | 0 | 0 | 10.0 | 10.4 | 4,243 | 1.2 | ||
SDLP | 3 | 1 | 1 | 10.0 | 8.8 | 3,600 | 0.3 | ||
Green (NI) | 0 | 0 | 0 | 0.0 | 0.9 | 372 | 0.2 | ||
TUV | 0 | 0 | 0 | 0.0 | 0.7 | 289 | New | ||
Independent | 0 | 0 | 0 | 0.0 | 0.7 | 288 | 0.7 | ||
NI Conservatives | 0 | 0 | 0 | 0.0 | 0.6 | 242 | 0.1 |
Note: "Votes" are the first preference votes.
Ward | % | Cllrs | % | Cllrs | % | Cllrs | % | Cllrs | % | Cllrs | % | Cllrs | Total Cllrs |
---|---|---|---|---|---|---|---|---|---|---|---|---|---|
DUP | Sinn Féin | UUP | Alliance | SDLP | Others | ||||||||
Downshire | 53.2 | 3 | 1.4 | 0 | 24.0 | 1 | 14.3 | 1 | 3.4 | 0 | 3.7 | 0 | 5 |
Dunmurry Cross | 10.8 | 1 | 65.7 | 5 | 3.3 | 1 | 4.4 | 0 | 15.8 | 1 | 0.0 | 0 | 7 |
Killultagh | 47.7 | 3 | 9.0 | 0 | 16.8 | 1 | 10.4 | 0 | 10.5 | 1 | 5.6 | 0 | 5 |
Lisburn Town North | 47.8 | 3 | 4.5 | 0 | 25.0 | 2 | 14.0 | 1 | 5.8 | 1 | 2.9 | 0 | 7 |
Lisburn Town South | 60.9 | 4 | 3.6 | 0 | 17.0 | 1 | 9.7 | 1 | 5.2 | 0 | 3.6 | 0 | 6 |
Total | 41.0 | 14 | 20.3 | 5 | 16.6 | 5 | 10.4 | 3 | 8.8 | 3 | 2.9 | 0 | 30 |
2005: 2 x DUP, 2 x UUP, 1 x Alliance
2011: 3 x DUP, 1 x UUP, 1 x Alliance
2005-2011 Change: DUP gain from UUP
Party | Candidate | FPv% | Count | |||||||
---|---|---|---|---|---|---|---|---|---|---|
1 | 2 | 3 | 4 | 5 | 6 | 7 | ||||
DUP | Allan Ewart* | 20.09% | 1,591 | |||||||
DUP | Paul Stewart | 19.64% | 1,555 | |||||||
DUP | Uel Mackin | 12.51% | 1,070 | 1,297.46 | 1,486.91 | |||||
Alliance | Jennifer Coulter* | 14.13% | 1,136 | 1,142.12 | 1,147.82 | 1,156.82 | 1,173.82 | 1,194.59 | 1,393.59 | |
UUP | James Baird | 13.28% | 1,052 | 1,065.94 | 1,081.99 | 1,143.64 | 1,143.64 | 1,248.96 | 1,266.03 | |
UUP | Alasdair O'Hara | 5.62% | 445 | 449.59 | 453.64 | 465.49 | 466.49 | 520.82 | 532.12 | |
UUP | Richard Price | 5.11% | 405 | 411.12 | 418.77 | 440.52 | 441.52 | 490.23 | 499.98 | |
SDLP | Christine Wilson | 3.40% | 269 | 269.68 | 271.78 | 273.58 | 348.75 | 352.2 | ||
TUV | Kaye Kilpatrick | 3.65% | 289 | 294.78 | 297.18 | 307.68 | 308.68 | |||
Sinn Féin | Fionnu McCaughley | 1.35% | 107 | 107.34 | 107.49 | 107.49 | ||||
Electorate: 13,764 Valid: 7,919 (57.53%) Spoilt: 114 Quota: 1,320 Turnout: 8,033 (58.36%) |
2005: 4 x Sinn Féin, 2 x SDLP, 1 x DUP
2011: 5 x Sinn Féin, 1 x SDLP, 1 x DUP
2005-2011 Change: Sinn Féin gain from SDLP
Party | Candidate | FPv% | Count | |||||||||
---|---|---|---|---|---|---|---|---|---|---|---|---|
1 | 2 | 3 | 4 | 5 | 6 | 7 | ||||||
Sinn Féin | David Bell | 17.19% | 1,796 | |||||||||
Sinn Féin | Charlene O'Hara | 13.07% | 1,365 | |||||||||
Sinn Féin | Arder Carson | 12.81% | 1,338 | |||||||||
Sinn Féin | Stephen Magennis | 11.02% | 1,151 | 1,553.57 | ||||||||
Sinn Féin | Angela Nelson* | 11.58% | 1,210 | 1,249.96 | 1,479.24 | |||||||
DUP | Margaret Tolerton | 10.84% | 1,132 | 1,132.81 | 1,133.45 | 1,134.41 | 1,357.41 | |||||
SDLP | Brian Heading* | 9.77% | 1,020 | 1,041.6 | 1,043.68 | 1,052.32 | 1,059.32 | 1,079.9 | 1,272.03 | |||
SDLP | Matthew McDermott | 6.02% | 629 | 637.64 | 639.08 | 646.44 | 653.71 | 684.79 | 843.54 | |||
Alliance | Aaron McIntyre | 4.38% | 458 | 459.89 | 460.53 | 462.45 | 533.61 | 539.91 | ||||
UUP | Mark Hill | 3.31% | 346 | 346.81 | 346.81 | 346.97 | ||||||
Electorate: 19,745 Valid: 10,445 (52.90%) Spoilt: 251 Quota: 1,306 Turnout: 10,696 (54.17%) |
2005: 3 x DUP, 1 x UUP, 1 x SDLP
2011: 3 x DUP, 1 x UUP, 1 x SDLP
2005-2011 Change: No change
Party | Candidate | FPv% | Count | ||||||
---|---|---|---|---|---|---|---|---|---|
1 | 2 | 3 | 4 | 5 | 6 | ||||
DUP | Thomas Beckett* | 20.54% | 1,756 | ||||||
DUP | James Tinsley* | 18.24% | 1,559 | ||||||
SDLP | Pat Catney | 10.50% | 898 | 902.37 | 902.93 | 923.23 | 1,526.23 | ||
UUP | Jim Dillon* | 8.91% | 762 | 788.03 | 794.91 | 917.97 | 919.97 | 1,425.97 | |
DUP | John Palmer | 8.94% | 764 | 1,007.01 | 1,108.05 | 1,211.76 | 1,216.49 | 1,342.28 | |
Alliance | Owen Gawith | 10.42% | 891 | 897.46 | 899.86 | 978.92 | 1,036.27 | 1,102.27 | |
UUP | Roy Hanna | 7.91% | 676 | 693.1 | 698.3 | 790.95 | 795.22 | ||
Sinn Féin | Mary-Kate Quinn | 9.03% | 772 | 773.14 | 773.7 | 778.08 | |||
Independent | Cecil Calvert* | 2.68% | 229 | 249.33 | 253.17 | ||||
NI Conservatives | Steve McIlwrath | 2.83% | 242 | 250.17 | 251.53 | ||||
Electorate: 16,299 Valid: 8,549 (52.45%) Spoilt: 140 Quota: 1,425 Turnout: 8,689 (53.31%) |
2005: 3 x DUP, 3 x UUP, 1 x Alliance
2011: 3 x DUP, 2 x UUP, 1 x Alliance, 1 x SDLP
2005-2011 Change: SDLP gain from UUP
Party | Candidate | FPv% | Count | ||||||||
---|---|---|---|---|---|---|---|---|---|---|---|
1 | 2 | 3 | 4 | 5 | 6 | 7 | 8 | ||||
DUP | Paul Givan * | 16.68% | 1,528 | ||||||||
DUP | Jonathan Craig * | 16.17% | 1,481 | ||||||||
Alliance | Brian Doran | 14.03% | 1,285 | ||||||||
DUP | William Leathem* | 9.71% | 889 | 1,164 | |||||||
UUP | Ronnie Crawford* | 10.52% | 963 | 986.25 | 1,012.17 | 1,033.77 | 1,119.77 | 1,148.77 | |||
UUP | Brian Bloomfield | 6.79% | 622 | 630.75 | 642.27 | 661.47 | 681.68 | 705.96 | 708.96 | 1,150.96 | |
SDLP | John Drake | 5.78% | 529 | 531 | 533.4 | 566.4 | 567.88 | 667.21 | 1,016.97 | 1,035.53 | |
DUP | Ben Mallon | 5.25% | 481 | 518.25 | 784.89 | 794.13 | 799.98 | 814.5 | 825.98 | 914.14 | |
UUP | David Archer | 5.91% | 541 | 555.75 | 571.59 | 583.11 | 629.15 | 656.63 | 660.87 | ||
Sinn Féin | Terry Quinn | 4.50% | 412 | 412.25 | 413.21 | 416.21 | 416.21 | 443.65 | |||
Green (NI) | Connor Quinn | 2.87% | 263 | 265.25 | 267.41 | 302.69 | 306.93 | ||||
UUP | Neil McNickle | 1.79% | 164 | 169.5 | 172.38 | 177.54 | |||||
Electorate: 17,438 Valid: 9,158 (52.52%) Spoilt: 127 Quota: 1,145 Turnout: 9,285 (53.24%) |
2005: 4 x DUP, 1 x UUP, 1 x Alliance
2011: 4 x DUP, 1 x UUP, 1 x Alliance
2005-2011 Change: No change
Party | Candidate | FPv% | Count | |||||||||
---|---|---|---|---|---|---|---|---|---|---|---|---|
1 | 2 | 3 | 4 | 5 | 6 | 7 | 8 | 9 | ||||
DUP | Paul Porter* | 27.57% | 1,340 | |||||||||
DUP | Andrew Ewing* | 14.42% | 701 | |||||||||
DUP | Jenny Palmer * | 13.31% | 647 | 1,018.42 | ||||||||
DUP | Roy Young | 5.62% | 273 | 457.73 | 702.6 | |||||||
Alliance | Stephen Martin | 9.73% | 473 | 483.78 | 488.48 | 496.48 | 496.74 | 551.72 | 587.19 | 663.15 | 756.15 | |
UUP | Alan Carlisle | 10.70% | 520 | 553.81 | 588.12 | 612.57 | 615.41 | 628.41 | 633.88 | 639.88 | 646.88 | |
UUP | Tim Mitchell | 6.32% | 307 | 322.19 | 346.16 | 361 | 362.76 | 375.74 | 378.74 | 380.29 | 392.29 | |
Sinn Féin | Patricia Magennis | 3.64% | 177 | 177.49 | 177.49 | 177.49 | 177.49 | 179.98 | 204.98 | 266.96 | ||
SDLP | Aisling Twomey | 2.65% | 129 | 133.9 | 135.78 | 137.78 | 137.88 | 141.86 | 189.86 | |||
SDLP | Marzena Czarnecka | 2.59% | 126 | 126.49 | 128.37 | 129.37 | 129.37 | 135.37 | ||||
Green (NI) | Luke Robinson | 2.24% | 109 | 113.9 | 117.66 | 121.13 | 121.25 | |||||
Independent | Colin Preen | 1.21% | 59 | 65.37 | 67.72 | |||||||
Electorate: 11,107 Valid: 4,861 (43.77%) Spoilt: 106 Quota: 695 Turnout: 4,967 (44.72%) |
Balmoral is the most southern of ten district electoral areas (DEA) in Belfast, Northern Ireland. The district elects five members to Belfast City Council and contains the wards of Belvoir; Finaghy; Malone; Musgrave; Windsor; and Upper Malone. Balmoral, along with neighbouring Botanic, forms the greater part of the Belfast South constituencies for the Northern Ireland Assembly and UK Parliament.
Elections to Belfast City Council were held on 5 May 2011 on the same day as the other Northern Irish local government elections. The election used nine district electoral areas to elect a total of 51 councillors, most representing the more heavily populated north and west.
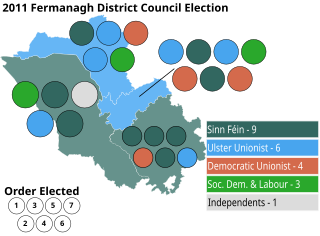
Elections to Fermanagh District Council were held on 5 May 2011 on the same day as the other Northern Irish local government elections. The election used four district electoral areas to elect a total of 23 councillors.
Elections to Lisburn City Council were held on 5 May 2005 on the same day as the other Northern Irish local government elections. The election used five district electoral areas to elect a total of 30 councillors.
Elections to Lisburn Borough Council were held on 17 May 1989 on the same day as the other Northern Irish local government elections. The election used four district electoral areas to elect a total of 28 councillors.
Elections to Newtownabbey Borough Council were held on 5 May 2011 on the same day as the other Northern Irish local government elections. The election used four district electoral areas to elect a total of 25 councillors.
Elections to Antrim Borough Council were held on 5 May 2011 on the same day as the other Northern Irish local government elections. The election used three district electoral areas to elect a total of 19 councillors.
Elections to Larne Borough Council were held on 5 May 2011 on the same day as the other Northern Irish local government elections. The election used three district electoral areas to elect a total of 15 councillors.
Elections to Ballymena Borough Council were held on 5 May 2011 on the same day as the other Northern Irish local government elections. The election used four district electoral areas to elect a total of 24 councillors.
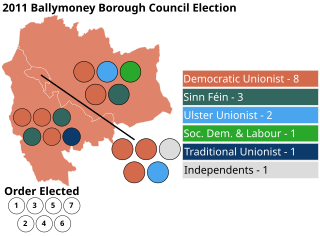
Elections to Ballymoney Borough Council were held on 5 May 2011 on the same day as the other Northern Irish local government elections. The election used three district electoral areas to elect a total of 16 councillors.
Elections to Coleraine Borough Council were held on 5 May 2011 on the same day as the other Northern Irish local government elections. The election used four district electoral areas to elect a total of 22 councillors.
Elections to Craigavon Borough Council were held on 5 May 2011 on the same day as the other Northern Irish local government elections. The election used four district electoral areas to elect a total of 26 councillors.
Elections to Banbridge District Council were held on 5 May 2011 on the same day as the other Northern Irish local government elections. The election used three district electoral areas to elect a total of 17 councillors.
Elections to Armagh City and District Council were held on 5 May 2011 on the same day as the other Northern Irish local government elections. The election used four district electoral areas to elect a total of 22 councillors.
Elections to Down District Council were held on 5 May 2011 on the same day as the other Northern Irish local government elections. The election used four district electoral areas to elect a total of 23 councillors.
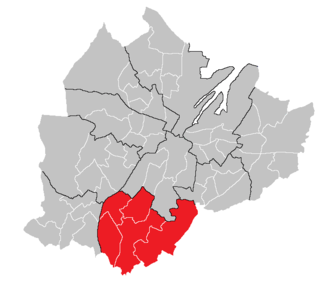
Elections to Newry and Mourne District Council were held on 5 May 2011 on the same day as the other Northern Irish local government elections. The election used five district electoral areas to elect a total of 30 councillors.
Castlereagh South is one of the seven district electoral areas (DEA) in Lisburn and Castlereagh, Northern Ireland. The district elects five members to Lisburn and Castlereagh City Council and contains the wards of Beechill, Cairnshill, Carryduff East, Carryduff West, Galwally, Knockbracken and Newtownbreda. Castlereagh South forms part of the Belfast South constituencies for the Northern Ireland Assembly and UK Parliament.
Lisburn North is one of the seven district electoral areas (DEA) in Lisburn and Castlereagh, Northern Ireland. The district elects six members to Lisburn and Castlereagh City Council and contains the wards of Derryaghy, Harmony Hill, Hilden, Lambeg, Magheralave and Wallace Park. Lisburn North forms part of the Lagan Valley constituencies for the Northern Ireland Assembly and UK Parliament.
Killultagh is one of the seven district electoral areas (DEA) in Lisburn and Castlereagh, Northern Ireland. The district elects five members to Lisburn and Castlereagh City Council and contains the wards of Ballinderry, Glenavy, Maghaberry, Stonyford and White Mountain. Killultagh forms part of the Lagan Valley constituencies for the Northern Ireland Assembly and UK Parliament, and part of the South Antrim constituencies for the Northern Ireland Assembly and UK Parliament.
Dunmurry Cross was one of the district electoral areas in Lisburn, Northern Ireland which existed from 1985 to 2014. It was one of four Lisburn DEAs until 1993, and one of five until 2014. The district elected seven members to Lisburn City Council and formed part of Belfast West constituencies for the Northern Ireland Assembly and UK Parliament and part of the Lagan Valley constituencies for the Northern Ireland Assembly and UK Parliament.