| ||||||||||||||||||||||||||||||||||||||||||||||||||||||||||||||||
All 23 seats to Down District Council 12 seats needed for a majority | ||||||||||||||||||||||||||||||||||||||||||||||||||||||||||||||||
---|---|---|---|---|---|---|---|---|---|---|---|---|---|---|---|---|---|---|---|---|---|---|---|---|---|---|---|---|---|---|---|---|---|---|---|---|---|---|---|---|---|---|---|---|---|---|---|---|---|---|---|---|---|---|---|---|---|---|---|---|---|---|---|---|
| ||||||||||||||||||||||||||||||||||||||||||||||||||||||||||||||||
![]() Party with the most votes by district. |
Elections to Down District Council were held on 5 May 2011 on the same day as the other Northern Irish local government elections. The election used four district electoral areas to elect a total of 23 councillors.
Party | Seats | Gains | Losses | Net gain/loss | Seats % | Votes % | Votes | +/− | |
---|---|---|---|---|---|---|---|---|---|
SDLP | 9 | 0 | 1 | ![]() | 39.1 | 34.2 | 8,666 | ![]() | |
Sinn Féin | 5 | 0 | 0 | ![]() | 21.7 | 22.9 | 5,806 | ![]() | |
DUP | 3 | 0 | 0 | ![]() | 13.0 | 16.4 | 4,152 | ![]() | |
UUP | 3 | 0 | 1 | ![]() | 13.0 | 13.2 | 3,346 | ![]() | |
Alliance | 1 | 1 | 0 | ![]() | 4.3 | 4.9 | 1,252 | ![]() | |
Independent | 1 | 1 | 0 | ![]() | 4.3 | 4.2 | 1,073 | ![]() | |
Green (NI) | 1 | 0 | 0 | ![]() | 4.3 | 4.1 | 1,035 | ![]() |
Note: "Votes" are the first preference votes.
Ward | % | Cllrs | % | Cllrs | % | Cllrs | % | Cllrs | % | Cllrs | % | Cllrs | % | Cllrs | Total Cllrs |
---|---|---|---|---|---|---|---|---|---|---|---|---|---|---|---|
SDLP | Sinn Féin | DUP | UUP | Alliance | Green | Others | |||||||||
Ballynahinch | 26.5 | 2 | 20.4 | 1 | 26.0 | 1 | 14.3 | 1 | 3.6 | 0 | 3.0 | 0 | 6.2 | 0 | 5 |
Downpatrick | 57.4 | 4 | 27.4 | 2 | 2.4 | 0 | 4.8 | 0 | 0.0 | 0 | 8.0 | 1 | 0.0 | 0 | 7 |
Newcastle | 33.3 | 2 | 36.3 | 2 | 7.8 | 0 | 9.5 | 1 | 8.4 | 1 | 4.6 | 0 | 0.0 | 0 | 6 |
Rowallane | 15.8 | 1 | 4.9 | 0 | 32.9 | 2 | 26.3 | 1 | 8.1 | 0 | 0.0 | 0 | 12.0 | 1 | 5 |
Total | 34.2 | 9 | 22.9 | 5 | 16.4 | 3 | 13.2 | 3 | 4.9 | 1 | 4.1 | 1 | 4.3 | 1 | 23 |
2005: 2 x SDLP, 1 x DUP, 1 x Sinn Féin, 1 x UUP
2011: 2 x SDLP, 1 x DUP, 1 x Sinn Féin, 1 x UUP
2005-2011 Change: No change
Party | Candidate | FPv% | Count | ||||||
---|---|---|---|---|---|---|---|---|---|
1 | 2 | 3 | 4 | 5 | 6 | ||||
DUP | Garth Craig | 21.32% | 1,260 | ||||||
Sinn Féin | Michael Coogan* | 20.41% | 1,206 | ||||||
UUP | Walter Lyons | 14.26% | 843 | 898.88 | 899.57 | 908.02 | 971.91 | 1,145.91 | |
SDLP | Anne Marie McAleenan* | 12.52% | 740 | 742.42 | 833.27 | 878.49 | 944.17 | 979.17 | |
SDLP | Patrick Toman* | 14.01% | 828 | 830.42 | 883.09 | 913.38 | 943.13 | 967.67 | |
Independent | Mark Murnin | 6.24% | 369 | 372.74 | 415.75 | 451.12 | 507.09 | 549.01 | |
DUP | Yvonne Moore | 4.65% | 275 | 478.28 | 478.97 | 485.97 | 504.19 | ||
Alliance | Andy Corkhill | 3.60% | 213 | 215.2 | 225.55 | 269.16 | |||
Green (NI) | Mark McCormick | 2.98% | 176 | 176.88 | 195.74 | ||||
Electorate: 10,680 Valid: 5,910 (55.34%) Spoilt: 116 Quota: 986 Turnout: 6,026 (56.42%) |
2005: 4 x SDLP, 2 x Sinn Féin, 1 x Green
2011: 2 x SDLP, 2 x Sinn Féin, 1 x Green
2005-2011 Change: No change
Party | Candidate | FPv% | Count | ||||||||
---|---|---|---|---|---|---|---|---|---|---|---|
1 | 2 | 3 | 4 | 5 | 6 | 7 | 8 | ||||
SDLP | Colin McGrath * | 16.64% | 1,144 | ||||||||
SDLP | Dermot Curran* | 14.53% | 999 | ||||||||
SDLP | Peter Craig* | 12.74% | 876 | ||||||||
Sinn Féin | Éamonn McConvey* | 12.10% | 832 | 850.25 | 850.5 | 859.95 | 1,019.95 | ||||
Sinn Féin | Liam Johnston* | 9.81% | 674 | 688.75 | 690.75 | 697.05 | 817.6 | 955.6 | |||
SDLP | John Doris* | 8.82% | 606 | 718.75 | 724 | 799.15 | 812.5 | 814.5 | 830.5 | 900.5 | |
Green (NI) | Cadogan Enright | 7.99% | 549 | 577.25 | 589.25 | 601.55 | 627.15 | 632.15 | 647.15 | 821.1 | |
SDLP | Gareth Sharvin | 4.66% | 320 | 407.25 | 418.5 | 440.4 | 484.65 | 492.65 | 506.65 | 552.05 | |
UUP | Annette Holden | 4.80% | 330 | 331.25 | 463.25 | 465.35 | 465.35 | 465.35 | 465.35 | ||
Sinn Féin | Martin Rice | 5.47% | 376 | 379.75 | 380.75 | 390.65 | |||||
DUP | Andrew Steenson | 2.44% | 168 | 175 | |||||||
Electorate: 13,640 Valid: 6,874 (50.40%) Spoilt: 163 Quota: 860 Turnout: 7,037 (51.59%) |
2005: 3 x SDLP, 2 x Sinn Féin, 1 x UUP
2011: 2 x SDLP, 2 x Sinn Féin, 1 x UUP, 1 x Alliance
2005-2011 Change: Alliance gain from SDLP
Party | Candidate | FPv% | Count | ||||||||
---|---|---|---|---|---|---|---|---|---|---|---|
1 | 2 | 3 | 4 | 5 | 6 | 7 | 8 | ||||
Sinn Féin | Willie Clarke * | 17.49% | 1,171 | ||||||||
SDLP | Eamon O'Neill * | 15.81% | 1,058 | ||||||||
SDLP | Carmel O'Boyle* | 11.47% | 768 | 787.08 | 831.63 | 917.34 | 1,181.34 | ||||
Sinn Féin | Stephen Burns | 11.89% | 796 | 892.84 | 898.42 | 931.95 | 958.95 | ||||
UUP | Desmond Patterson | 9.50% | 636 | 636.54 | 637.8 | 655.98 | 663.7 | 676.7 | 1,124.7 | ||
Alliance | Patrick Clarke | 8.44% | 565 | 570.58 | 575.26 | 665.8 | 702.72 | 746.72 | 773.35 | 936.55 | |
Sinn Féin | Brian Morgan | 6.95% | 465 | 531.06 | 532.95 | 542.03 | 615.75 | 668.75 | 670.02 | 672.9 | |
DUP | Stanley Priestley | 7.80% | 522 | 522.54 | 523.98 | 526.16 | 528.34 | 528.34 | |||
SDLP | Peter Fitzpatrick* | 6.02% | 403 | 412.72 | 442.69 | 470.59 | |||||
Green (NI) | John Hardy | 4.63% | 310 | 315.76 | 318.55 | ||||||
Electorate: 12,216 Valid: 6,694 (54.80%) Spoilt: 132 Quota: 957 Turnout: 6,826 (55.88%) |
2005: 2 x DUP, 2 x UUP, 1 x SDLP
2011: 2 x DUP, 1 x UUP, 1 x SDLP, 1 x Independent
2005-2011 Change: Independent gain from UUP
Party | Candidate | FPv% | Count | ||||
---|---|---|---|---|---|---|---|
1 | 2 | 3 | 4 | ||||
DUP | William Dick* | 17.21% | 1,007 | ||||
SDLP | Maria McCarthy | 13.82% | 809 | 1,092 | |||
UUP | Robert Burgess* | 14.30% | 837 | 840 | 969 | 982.26 | |
DUP | William Walker* | 15.72% | 920 | 927 | 971 | 976.46 | |
Independent | Terry Andrews | 12.03% | 704 | 763 | 884 | 976.04 | |
UUP | Graham Furey | 11.96% | 700 | 705 | 761 | 764.9 | |
Alliance | Patrick Brown | 8.10% | 474 | 491 | |||
Sinn Féin | Catriona Mackel | 4.89% | 286 | ||||
SDLP | Patricia McKay | 1.97% | 115 | ||||
Electorate: 11,090 Valid: 5,852 (52.77%) Spoilt: 83 Quota: 976 Turnout: 5,935 (53.52%) |
Castle is one of the ten district electoral areas in Belfast, Northern Ireland. Located in the north of the city, the district elects six members to Belfast City Council and contains the wards of Bellevue, Cavehill, Chichester Park, Duncairn, Fortwilliam and Innisfayle. Castle, along with Oldpark district and parts of the Court district and Newtownabbey Borough Council, forms the Belfast North constituency for the Northern Ireland Assembly and UK Parliament. The district is bounded to the east by the Victoria Channel, to the north by Newtownabbey Borough Council and Belfast Lough, to the south by North Street and to the west by the Cavehill Road.
Elections to Belfast City Council were held on 5 May 2011 on the same day as the other Northern Irish local government elections. The election used nine district electoral areas to elect a total of 51 councillors, most representing the more heavily populated north and west.
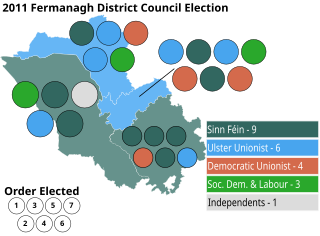
Elections to Fermanagh District Council were held on 5 May 2011 on the same day as the other Northern Irish local government elections. The election used four district electoral areas to elect a total of 23 councillors.
Elections to Lisburn City Council were held on 5 May 2011 on the same day as the other Northern Irish local government elections. The election used five district electoral areas to elect a total of 30 councillors.
Elections to Newtownabbey Borough Council were held on 5 May 2011 on the same day as the other Northern Irish local government elections. The election used four district electoral areas to elect a total of 25 councillors.
Elections to Antrim Borough Council were held on 5 May 2011 on the same day as the other Northern Irish local government elections. The election used three district electoral areas to elect a total of 19 councillors.
Elections to Larne Borough Council were held on 5 May 2011 on the same day as the other Northern Irish local government elections. The election used three district electoral areas to elect a total of 15 councillors.
Elections to Ballymena Borough Council were held on 5 May 2011 on the same day as the other Northern Irish local government elections. The election used four district electoral areas to elect a total of 24 councillors.
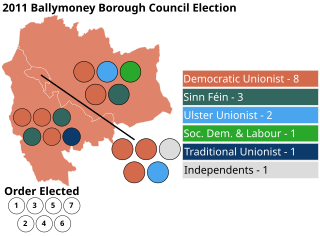
Elections to Ballymoney Borough Council were held on 5 May 2011 on the same day as the other Northern Irish local government elections. The election used three district electoral areas to elect a total of 16 councillors.
Elections to Moyle District Council were held on 5 May 2011 on the same day as the other Northern Irish local government elections. The election used three district electoral areas to elect a total of 15 councillors.
Elections to Coleraine Borough Council were held on 5 May 2011 on the same day as the other Northern Irish local government elections. The election used four district electoral areas to elect a total of 22 councillors.
Elections to Craigavon Borough Council were held on 5 May 2011 on the same day as the other Northern Irish local government elections. The election used four district electoral areas to elect a total of 26 councillors.
Elections to Banbridge District Council were held on 5 May 2011 on the same day as the other Northern Irish local government elections. The election used three district electoral areas to elect a total of 17 councillors.
Elections to Armagh City and District Council were held on 5 May 2011 on the same day as the other Northern Irish local government elections. The election used four district electoral areas to elect a total of 22 councillors.
Elections to Newry and Mourne District Council were held on 5 May 2011 on the same day as the other Northern Irish local government elections. The election used five district electoral areas to elect a total of 30 councillors.
Elections to Dungannon and South Tyrone Borough Council were held on 5 May 2011 on the same day as the other Northern Irish local government elections. The election used four district electoral areas to elect a total of 22 councillors.
Elections to Strabane District Council were held on 5 May 2011 on the same day as the other Northern Irish local government elections. The election used three district electoral areas to elect a total of 16 councillors.
Banbridge is one of the seven district electoral areas (DEA) in Armagh City, Banbridge and Craigavon, Northern Ireland. The district elects seven members to Armagh City, Banbridge and Craigavon Borough Council and contains the wards of Banbridge East, Banbridge North, Banbridge South, Banbridge West, Gilford, Loughbrickland and Rathfriland. Banbridge forms part of the Upper Bann constituencies for the Northern Ireland Assembly and UK Parliament.
Portadown is one of the seven district electoral areas (DEA) in Armagh City, Banbridge and Craigavon, Northern Ireland. The district elects six members to Armagh City, Banbridge and Craigavon Borough Council and contains the wards of Ballybay, Corcrain, Killycomain, Loughgall, Mahon and The Birches. Portadown forms part of the Upper Bann constituencies for the Northern Ireland Assembly and UK Parliament.
Waterside is one of the seven district electoral areas (DEA) in Derry and Strabane, Northern Ireland. The district elects seven members to Derry and Strabane District Council and contains the wards of Caw, Clondermot, Drumahoe, Ebrington, Kilfennan, Lisnagelvin and Victoria. Waterside forms part of the Foyle constituencies for the Northern Ireland Assembly and UK Parliament.