David John Nellist is a British Trotskyist activist who was the MP for the constituency of Coventry South East from 1983 to 1992. Elected as a Labour MP, his support for the Militant tendency led to his eventual expulsion from the party in late 1991. He is the National Chair of the Trade Unionist and Socialist Coalition (TUSC), a member of the Socialist Party, and was a city councillor in Coventry from 1998 to 2012.

The 2012 Scottish local elections were held on 3 May 2012 in all 32 local authorities. The Scottish National Party (SNP) overtook Labour to win the highest share of the vote, and retained and strengthened its position as the party with most councillors. Labour also made gains, while the Liberal Democrats experienced meltdown, losing over half their seats and falling behind the Conservatives. For the first time since the introduction of the Single Transferable Vote system, the SNP won majority control of 2 councils, from no overall control. Labour also won majority control of 2 councils from no overall control, while retaining majority control over 2 councils.
The 2000 Stratford-on-Avon District Council election took place on 4 May 2000 to elect members of Stratford-on-Avon District Council in Warwickshire, England. One third of the council was up for election and the Conservative Party gained overall control of the council from no overall control.
The 2002 Stratford-on-Avon District Council election took place on 2 May 2002 to elect members of Stratford-on-Avon District Council in Warwickshire, England. The whole council was up for election with boundary changes since the last election in 2000 reducing the number of seats by 2. The Conservative Party stayed in overall control of the council.

The 2008 Stratford-on-Avon District Council election took place on 1 May 2008 to elect members of Stratford-on-Avon District Council in Warwickshire, England. One third of the council was up for election and the Conservative Party stayed in overall control of the council.
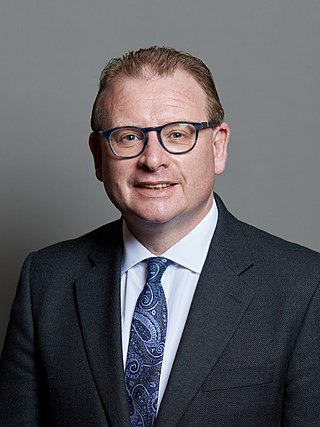
Marcus Charles Jones is an English Conservative Party politician who was the Member of Parliament (MP) for Nuneaton from 2010 to 2024. Previously he had been the Leader of Nuneaton and Bedworth Borough Council. He had previously served as Government Deputy Chief Whip and Treasurer of the Household since October 2022.
The 1999 Pendle Borough Council election took place on 6 May 1999 to elect members of Pendle Borough Council in Lancashire, England. One third of the council was up for election and the Liberal Democrats lost overall control of the council to no overall control.

The 2006 Pendle Borough Council election took place on 4 May 2006 to elect members of Pendle Borough Council in Lancashire, England. One third of the council was up for election and the Liberal Democrats stayed in overall control of the council.

Elections for Coventry City Council were held on Thursday, 3 May 2012, the same day as other 2012 local elections in the United Kingdom. As the council is elected by thirds, one seat in each of the city's 18 wards was up for election. The Labour Party won the seat in 15 of the wards, gaining a total of 8 and increasing their majority to 32 seats. The Conservative Party won the remaining three seats, losing six, with the Liberal Democrats and the Socialist Party both losing their only seat on the council.

The 2003 Hertsmere Borough Council election took place on 1 May 2003 to elect members of Hertsmere Borough Council in Hertfordshire, England. One third of the council was up for election and the Conservative Party stayed in overall control of the council.

The 2012 City of Bradford Metropolitan District Council election took place on 3 May 2012. The elections took place shortly after the Bradford West by-election, in which the Respect Party's George Galloway pulled off a shock victory against the incumbent Labour Party. Held alongside was a referendum on directly elected mayors. The Labour Party were one seat short of an overall majority following the election, leaving the council in no overall control.

The 2012 Pendle Borough Council election took place on 3 May 2012 to elect members of Pendle Borough Council in Lancashire, England. One third of the council was up for election and the council stayed under no overall control.

The 2015 Cheshire West and Chester Council election took place on 7 May 2015, electing members of Cheshire West and Chester Council in England. This was on the same day as other local elections across the country as well as the general election.

The 2021 Nuneaton and Bedworth Borough Council election was held on 6 May 2021 as part of the 2021 United Kingdom local elections and alongside elections for Warwickshire County Council and Warwickshire Police and Crime Commissioner. Half of the borough council seats were up for election and the results provided the Conservative Party with a majority on the council, with the party winning all but two seats up for election.

Elections to the City of Edinburgh Council took place on 5 May 2022 on the same day as the 31 other Scottish local government elections. As with other Scottish council elections, it was held using single transferable vote (STV) – a form of proportional representation – in which multiple candidates are elected in each ward and voters rank candidates in order of preference.

Elections to Glasgow City Council took place on 5 May 2022 on the same day as the 31 other Scottish local government elections. As with other Scottish council elections, it was held using single transferable vote (STV) – a form of proportional representation – in which multiple candidates are elected in each ward and voters rank candidates in order of preference.

Elections to South Ayrshire Council took place on 5 May 2022 on the same day as the 31 other Scottish local government elections. As with other Scottish council elections, it was held using single transferable vote (STV) – a form of proportional representation – in which multiple candidates are elected in each ward and voters rank candidates in order of preference.

Elections to Argyll and Bute Council took place on 5 May 2022, the same day as the 31 other Scottish local government elections. As with other Scottish council elections, it was held using single transferable vote (STV)—a form of proportional representation—in which multiple candidates are elected in each ward and voters rank candidates in order of preference. New ward boundaries were proposed by Boundaries Scotland in 2021, which would have reduced the total number of councillors to 34. However, these were rejected by the Scottish Parliament and the boundaries used at the previous election remained in place.

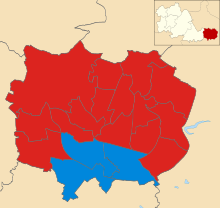
The 2022 Nuneaton and Bedworth Borough Council election was held on 5 May 2022 to elect members of Nuneaton and Bedworth Borough Council. Seventeen seats of the thirty-four seats on the council were elected, as part of the wider 2022 local elections.

Elections to Aberdeen City Council took place on 5 May 2022 on the same day as the 31 other Scottish local government elections. As with other Scottish council elections, it was held using single transferable vote (STV) – a form of proportional representation – in which multiple candidates are elected in each ward and voters rank candidates in order of preference.