2011 St Helens Metropolitan Borough Council election

Last updated

Map of the results of the 2011 St Helens Metropolitan Borough Council election. Labour in red, Liberal Democrats in yellow and Conservatives in blue. St Helens UK local election 2011 map.svg
Map of the results of the 2011 St Helens Metropolitan Borough Council election. Labour in red, Liberal Democrats in yellow and Conservatives in blue.

The 2011 St Helens Metropolitan Borough Council election took place on 5 May 2011 to elect members of St Helens Metropolitan Borough Council in Merseyside, England. One third of the council was up for election and the Labour Party stayed in overall control of the council. [1]

Contents

After the election, the composition of the council was:

Background

At the last election in 2010 Labour took control of the council with 28 seats after gaining 5 seats, while the Liberal Democrats dropped to 15 seats and the Conservatives were reduced to 5 seats. [3] Labour were expected to make more gains in 2011, with the Liberal Democrats in particular expected to suffer from being in a coalition government with the Conservatives nationally. [4]

Both Labour and the Liberal Democrats were defending 7 seats in 2011, while the Conservatives defended 2 seats. [5] Other candidates at the election included 4 from the Green Party, who had not put candidates up in previous elections. [5]

Election result

Labour increased its majority on the council after gaining 7 seats, including 6 from the Liberal Democrats. [6] This took Labour to 35 councillors, while reducing the Liberal Democrats to 9 seats on the council, with the only Liberal Democrat to be elected being Michael Haw in Eccleston. [6] Meanwhile, the wife of the Conservative group leader, Nancy Ashcroft, lost her seat on the council in Windle to Labour, reducing the Conservatives to 4 seats on the council. [6]

St Helens local election result 2011 [2] [7]
PartySeatsGainsLossesNet gain/lossSeats %Votes %Votes+/−
  Labour 1470+787.560.131,165+11.9%
  Liberal Democrats 106-66.317.59,085-12.9%
  Conservative 101-16.317.18,836-1.2%
  Green 000002.01,061+2.0%
  Independent 000001.7901+1.5%
  BNP 000001.0524-1.9%
  UKIP 000000.5247+0.5%

Ward results

Billinge and Seneley Green [7]
PartyCandidateVotes%±%
Labour Joseph Pearson1,89652.9+3.3
Conservative Michael Hodgson96426.9-3.1
Independent Peter Peers55615.5+15.5
Liberal Democrats Stephen Knowles1704.7-15.7
Majority93226.0+6.4
Turnout 3,58640.1-27.0
Labour hold Swing
Blackbrook [7]
PartyCandidateVotes%±%
Labour Linda Maloney2,35477.0+19.3
Liberal Democrats Brian Bonney35311.5-14.1
Conservative Judith Collins35011.4+0.4
Majority2,00165.5+23.4
Turnout 3,05736.4-22.8
Labour hold Swing
Bold [7]
PartyCandidateVotes%±%
Labour Anthony Johnson1,93970.3+22.0
Liberal Democrats Marise Roberts41315.0-20.0
Conservative Charmian Pyke2288.3-1.6
BNP James Winstanley1796.5-0.3
Majority1,52655.3+42.0
Turnout 2,75936.5-20.9
Labour gain from Liberal Democrats Swing
Earlestown [7]
PartyCandidateVotes%±%
Labour Keith Deakin1,84569.3+11.8
Liberal Democrats David Smith42215.9-10.1
Conservative David Skeech39414.8-1.7
Majority1,42353.5+22.0
Turnout 2,66132.9-21.4
Labour hold Swing
Eccleston [7]
PartyCandidateVotes%±%
Liberal Democrats Michael Haw1,54036.8-8.5
Labour Sophie Robinson1,40133.5+3.7
Conservative Kathleen Barton90421.6-0.1
Green Francis Williams3368.0+8.0
Majority1393.3-12.2
Turnout 4,18145.1-24.9
Liberal Democrats hold Swing
Haydock [7]
PartyCandidateVotes%±%
Labour Jeanette Banks2,01062.0+10.5
Liberal Democrats Janet Sheldon76523.6-13.4
UKIP Gary Robinson2477.6+7.6
Conservative Robert Reynolds2216.8-4.7
Majority1,24538.4+23.9
Turnout 3,24335.6-24.5
Labour gain from Liberal Democrats Swing
Moss Bank [7]
PartyCandidateVotes%±%
Labour John Fulham2,03154.0+7.7
Liberal Democrats David Kent1,19931.9-8.6
Independent David Lawrenson3459.2+9.2
Conservative Anthony Rigby1834.9-8.3
Majority83222.1+16.2
Turnout 3,75843.9-17.0
Labour gain from Liberal Democrats Swing
Newton [7]
PartyCandidateVotes%±%
Labour Sandra Dyer1,43246.0+10.7
Liberal Democrats Peter Astbury1,31142.1-6.2
Conservative Brian Honey36911.9-4.5
Majority1213.9
Turnout 3,11236.6-23.1
Labour gain from Liberal Democrats Swing
Parr [7]
PartyCandidateVotes%±%
Labour Keith Roberts2,02683.9+12.4
Liberal Democrats Paul Brown2219.2-9.9
Conservative Madeleine Wilcock1687.0-2.4
Majority1,80574.7+22.2
Turnout 2,41527.9-17.3
Labour hold Swing
Rainford [7]
PartyCandidateVotes%±%
Conservative James Jones1,79253.8+4.5
Labour Keith Aspinall1,18435.5+1.3
Green Carla Hay2557.7+7.7
Liberal Democrats Frederick Barrett1023.1-13.5
Majority60818.2+3.1
Turnout 3,33349.9-21.5
Conservative hold Swing
Rainhill [7]
PartyCandidateVotes%±%
Labour Joseph De Asha2,56964.7+18.4
Conservative John Cunliffe85321.5+2.2
Liberal Democrats Denise Aspinall54913.8-16.1
Majority1,71643.2+26.8
Turnout 3,97144.3-22.0
Labour hold Swing
Sutton [7]
PartyCandidateVotes%±%
Labour Janet Johnson2,15163.5+23.4
Liberal Democrats Kenneth Knowles83624.7-20.2
Conservative Barbara Woodcock2186.4-2.2
BNP Peter Clayton1845.4-1.0
Majority1,31538.8
Turnout 3,38937.3-19.7
Labour gain from Liberal Democrats Swing
Thatto Heath [7]
PartyCandidateVotes%±%
Labour Patricia Ireland2,40978.1+19.4
Conservative Henry Spriggs39512.8-0.6
Liberal Democrats Carol Pearl2829.1-11.9
Majority2,01465.3+27.6
Turnout 3,08632.7-22.0
Labour hold Swing
Town Centre [7]
PartyCandidateVotes%±%
Labour Geoffrey Almond1,96273.0+19.0
Liberal Democrats Lynn Turton56220.9-8.0
Conservative Richard Barton1636.1-2.6
Majority1,40052.1+27.0
Turnout 2,68732.7-16.2
Labour gain from Liberal Democrats Swing
West Park [7]
PartyCandidateVotes%±%
Labour Marlene Quinn2,29369.3+10.6
Conservative David Foster38611.7-0.5
Liberal Democrats Ruth Watmough2457.4-13.1
Green William Fitzpatrick2246.8+6.8
BNP Leila Bentham1614.9-0.6
Majority1,90757.6+19.4
Turnout 3,30937.1-21.1
Labour hold Swing
Windle [7]
PartyCandidateVotes%±%
Labour Patricia Martinez-Williams1,66350.8+6.8
Conservative Nancy Ashcroft1,24838.1+2.3
Green Andrew Donnelly2467.5+7.5
Liberal Democrats Noreen Knowles1153.5-16.7
Majority41512.7+4.5
Turnout 3,27240.6-21.5
Labour gain from Conservative Swing

Related Research Articles

<span class="mw-page-title-main">Metropolitan Borough of Wigan</span> Borough of Greater Manchester, England

The Metropolitan Borough of Wigan is a metropolitan borough of Greater Manchester, England. It is named after its largest town, Wigan but covers a far larger area which includes the towns of Atherton, Ashton-in-Makerfield, Golborne, Hindley, Ince-in-Makerfield, Leigh and Tyldesley. The borough also covers the villages and suburbs of Abram, Aspull, Astley, Bryn, Hindley Green, Lowton, Mosley Common, Orrell, Pemberton, Shevington, Standish, Winstanley and Worsley Mesnes. The borough is also the second-most populous district in Greater Manchester.

<span class="mw-page-title-main">2006 United Kingdom local elections</span>

The 2006 United Kingdom local elections were held on Thursday 4 May 2006.

The 1998 St Helens Metropolitan Borough Council election took place on 7 May 1998 to elect members of St Helens Metropolitan Borough Council in Merseyside, England. One third of the council was up for election and the Labour Party stayed in overall control of the council.

The 1999 St Helens Metropolitan Borough Council election took place on 6 May 1999 to elect members of St Helens Metropolitan Borough Council in Merseyside, England. One third of the council was up for election and the Labour Party stayed in overall control of the council.

The 2000 St Helens Metropolitan Borough Council election took place on 4 May 2000 to elect members of St Helens Metropolitan Borough Council in Merseyside, England. One third of the council was up for election and the Labour party stayed in overall control of the council.

<span class="mw-page-title-main">2002 St Helens Metropolitan Borough Council election</span>

The 2002 St Helens Metropolitan Borough Council election took place on 2 May 2002 to elect members of St Helens Metropolitan Borough Council in Merseyside, England. One third of the council was up for election and the Labour Party stayed in overall control of the council.

<span class="mw-page-title-main">2003 St Helens Metropolitan Borough Council election</span>

The 2003 St Helens Metropolitan Borough Council election took place on 1 May 2003 to elect members of St Helens Metropolitan Borough Council in Merseyside, England. One third of the council was up for election and the Labour Party stayed in overall control of the council.

<span class="mw-page-title-main">2004 St Helens Metropolitan Borough Council election</span>

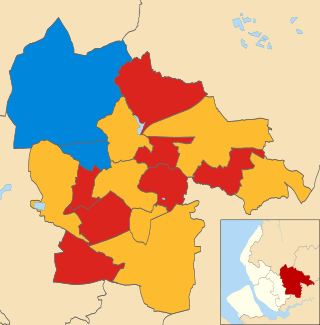
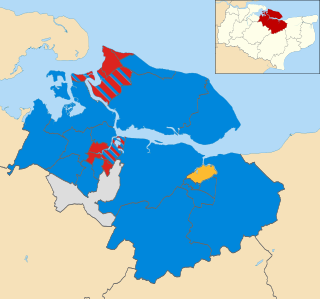
The 2004 St Helens Metropolitan Borough Council election took place on 10 June 2004 to elect members of St Helens Metropolitan Borough Council in Merseyside, England. The whole council was up for election with boundary changes since the last election in 2003 reducing the number of seats by six. The Labour Party lost overall control of the council to no overall control.

<span class="mw-page-title-main">2006 St Helens Metropolitan Borough Council election</span>

The 2006 St Helens Metropolitan Borough Council election took place on 4 May 2006 to elect members of St Helens Metropolitan Borough Council in Merseyside, England. One third of the council was up for election and the council stayed under no overall control.

<span class="mw-page-title-main">1998 Solihull Metropolitan Borough Council election</span>

The 1998 Solihull Metropolitan Borough Council election took place on 7 May 1998 to elect members of Solihull Metropolitan Borough Council in the West Midlands, England. One third of the council was up for election and the council stayed under no overall control.

<span class="mw-page-title-main">2008 St Helens Metropolitan Borough Council election</span>

The 2008 St Helens Metropolitan Borough Council election took place on 1 May 2008 to elect members of St Helens Metropolitan Borough Council in Merseyside, England. One third of the council was up for election and the council stayed under no overall control.

<span class="mw-page-title-main">2007 St Helens Metropolitan Borough Council election</span> Council election in Merseyside, England

The 2007 St Helens Metropolitan Borough Council election took place on 3 May 2007 to elect members of St Helens Metropolitan Borough Council in Merseyside, England. One third of the council was up for election and the council stayed under no overall control.

The 2008 Halton Borough Council election took place on 1 May 2008 to elect members of Halton Unitary Council in Cheshire, England. One third of the council was up for election and the Labour party stayed in overall control of the council.

The 2006 Halton Borough Council election took place on 4 May 2006 to elect members of Halton Unitary Council in Cheshire, England. One third of the council was up for election and the Labour party stayed in overall control of the council.

<span class="mw-page-title-main">2010 St Helens Metropolitan Borough Council election</span>

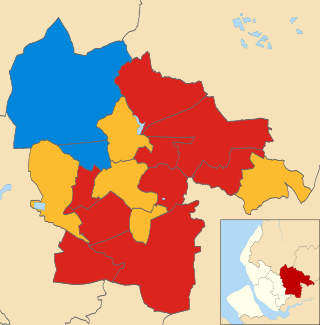
The 2010 St Helens Metropolitan Borough Council election took place on 6 May 2010 to elect members of St Helens Metropolitan Borough Council in Merseyside, England. One third of the council was up for election and the Labour Party gained overall control of the council from no overall control.

<span class="mw-page-title-main">2012 St Helens Metropolitan Borough Council election</span>

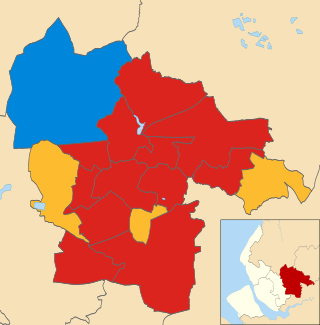
The 2012 St Helens Metropolitan Borough Council election took place on 3 May 2012 to elect members of St Helens Metropolitan Borough Council in Merseyside, England. One third of the council was up for election and the LabourPparty stayed in overall control of the council.

<span class="mw-page-title-main">2014 St Helens Metropolitan Borough Council election</span>

The 2014 St Helens Metropolitan Borough Council election took place on 22 May 2014 to elect members of St Helens Metropolitan Borough Council in Merseyside, England. One third of the council was up for election and the Labour Party stayed in overall control of the council.

<span class="mw-page-title-main">2011 Swale Borough Council election</span>

The 2011 Swale Borough Council election took place on 5 May 2011 to elect members of Swale Borough Council in Kent, England. The whole council was up for election and the Conservative Party stayed in overall control of the council.

<span class="mw-page-title-main">2022 St Helens Metropolitan Borough Council election</span> 2022 local election in St Helens

The 2022 St Helens Metropolitan Borough Council election took place on 5 May 2022. Due to boundary changes, all 48 councillors were elected at the same time, with the council moving to a system of all-out elections every four years. The election took place alongside other local elections across the United Kingdom.

The 2022 Sefton Metropolitan Borough Council election took place on 5 May 2022 to elect members of Sefton Council. This was on the same day as other local elections. 21 of the 66 seats were up for election, with 1 ward being uncontested.

References

  1. "England council elections". BBC News Online. 10 May 2011. Retrieved 4 March 2015.
  2. 1 2 "Local authority elections: England". The Guardian . NewsBank. 7 May 2011.
  3. "St Helens". BBC News Online. 19 May 2010. Retrieved 6 March 2015.
  4. "Labour expected to extend poll majority in St Helens". Liverpool Daily Post . NewsBank. 25 April 2011.
  5. 1 2 "Voters in St Helens go to the polls". St Helens Star . NewsBank. 5 May 2011.
  6. 1 2 3 Bartlett, David (7 May 2011). "Lib Dems left shattered". Liverpool Echo . NewsBank.
  7. 1 2 3 4 5 6 7 8 9 10 11 12 13 14 15 16 17 "Declaration of Result of Poll" (PDF). St Helens Council. Archived from the original (PDF) on 4 March 2016. Retrieved 4 March 2015.