Elections to Wyre Borough Council were held on 5 May 2011, along with the 2011 United Kingdom Alternative Vote referendum. [1] All 55 councillors were elected from 26 wards in elections held every four years. [2] The Conservative Party stayed in overall control of the council. [3]
The Local Government Boundary Commission for England reviewed the electoral wards of Wyre Borough Council in 2014 with the new electoral map to be elected for the first time at the 2015 Wyre Borough Council election.
Following the election, the composition of the council is now as follows:
Party | Seats | ± | |
---|---|---|---|
Conservative | 40 | –5 | |
Labour | 15 | +7 | |
Liberal Democrat | 0 | –1 | |
Independent | 0 | –1 |
Party | Seats | Gains | Losses | Net gain/loss | Seats % | Votes % | Votes | +/− | |
---|---|---|---|---|---|---|---|---|---|
Conservative | 40 | 1 | 6 | –5 | 72.73 | 60.23 | 45,140 | -3.62% | |
Labour | 15 | 7 | 0 | +7 | 27.27 | 35.13 | 26,331 | +6.78% | |
UKIP | 0 | 0 | 0 | 0 | 0 | 2.53 | 1,894 | +0.28% | |
Independent | 0 | 0 | 1 | –1 | 0 | 1.46 | 1,095 | +1.46% | |
Green | 0 | 0 | 0 | 0 | 0 | 0.65 | 485 | +0.65% | |
Liberal Democrats | 0 | 0 | 1 | –1 | 0 | 0 | 0 | -4.85% |
Party | Candidate | Votes | % | ±% | |
---|---|---|---|---|---|
Labour | Terry Lees | 1,013 | 18.29 | +4.022 | |
Conservative | Don Macnaughton | 942 | 17.01 | −2.57 | |
Conservative | Julie Vanessa Newsham | 912 | 16.47 | –3.08 | |
Labour | Sean Hazlewood | 901 | 16.27 | +2.14 | |
Conservative | Christopher Robert McConnachie | 894 | 16.14 | −2.42 | |
Labour | Kevin Ronald Hogginson | 876 | 15.82 | +1.90 | |
Turnout | 5,538 | 40.2 | |||
Labour gain from Conservative | Swing | +6.59 | |||
Conservative hold | Swing | -4.57 | |||
Conservative hold | Swing | -4.77 |
Party | Candidate | Votes | % | ±% | |
---|---|---|---|---|---|
Conservative | Peter Gibson | 761 | 40.39 | +3.64 | |
Conservative | David John Henderson | 758 | 40.23 | +1.88 | |
Labour | Richard Hobson | 365 | 19.37 | +6.02 | |
Turnout | 1,884 | 42.9 | –11.13 | ||
Conservative hold | Swing | -4.17 | |||
Conservative hold | Swing | -4.14 |
Party | Candidate | Votes | % | ±% | |
---|---|---|---|---|---|
Conservative | Pete Murphy | Unopposed | N/A | N/A | |
Majority | N/A | N/A | N/A | ||
Turnout | N/A | N/A | N/A | ||
Conservative hold | Swing |
Party | Candidate | Votes | % | ±% | |
---|---|---|---|---|---|
Conservative | Robert William Brooks | 444 | 70.48 | –5.24 | |
Labour | Faron Stuart Young | 186 | 29.52 | +5.24 | |
Majority | 258 | 40.95 | –10.66 | ||
Turnout | 630 | 48.3 | +1.29 | ||
Conservative hold | Swing | -10.48 |
Party | Candidate | Votes | % | ±% | |
---|---|---|---|---|---|
Conservative | David Williams | 535 | 75.35 | +9.04 | |
UKIP | Simon Noble | 175 | 24.65 | N/A | |
Majority | 360 | 50.70 | +18.08 | ||
Turnout | 710 | ||||
Conservative hold | Swing |
Party | Candidate | Votes | % | ±% | |
---|---|---|---|---|---|
Conservative | James Hargeaves | 914 | 31.94 | –3.50 | |
Conservative | May Gandhi | 905 | 31.62 | –2.67 | |
Labour | Andy Walker | 556 | 19.43 | +4.80 | |
Labour | Frank William Turner | 487 | 17.02 | +1.38 | |
Turnout | 2,862 | 46.6 | |||
Conservative hold | Swing | -7.29 | |||
Conservative hold | Swing | -5.06 |
Party | Candidate | Votes | % | ±% | |
---|---|---|---|---|---|
Conservative | Dave Swift | Unopposed | N/A | N/A | |
Majority | N/A | N/A | N/A | ||
Turnout | N/A | N/A | N/A | ||
Conservative gain from Liberal Democrats | Swing |
Party | Candidate | Votes | % | ±% | |
---|---|---|---|---|---|
Conservative | Andrea Kay | 1,210 | 19.01 | −0.20 | |
Conservative | Rita Amos | 1,102 | 17.31 | +0.33 | |
Labour | Penny Martin | 1,077 | 16.92 | +1.05 | |
Conservative | Tony Morley | 1,068 | 16.78 | +0.35 | |
Labour | David Oxley | 978 | 15.36 | +0.57 | |
Labour | John Damien Traynor | 931 | 14.63 | +0.56 | |
Turnout | 6,366 | 48.7 | +13.6 | ||
Conservative hold | Swing | +0.31 | |||
Conservative hold | Swing | 0.49 | |||
Labour gain from Conservative | Swing | +0.70 |
Party | Candidate | Votes | % | ±% | |
---|---|---|---|---|---|
Conservative | Dulcie Mary Atkins | 1,272 | 30.29 | +3.06 | |
Conservative | Alice Collinson | 1,223 | 29.12 | +4.56 | |
Conservative | Tom Balmain | 1,073 | 25.56 | +3.96 | |
Labour | Marilyn Levey | 632 | 15.05 | N/A | |
Turnout | 4,200 | 48.6 | –14.02 | ||
Conservative hold | Swing | +2.52 | |||
Conservative hold | Swing | +1.61 | |||
Conservative hold | Swing | +1.01 |
Party | Candidate | Votes | % | ±% | |
---|---|---|---|---|---|
Conservative | Susan Catteral | 1,089 | 49.93 | N/A | |
Conservative | Susan Pimbley | 824 | 37.78 | N/A | |
Labour | Al Davies | 268 | 12.29 | N/A | |
Turnout | 2,181 | 48.6 | N/A | ||
Conservative hold | Swing | N/A | |||
Conservative hold | Swing | N/A |
Party | Candidate | Votes | % | ±% | |
---|---|---|---|---|---|
Conservative | Julie Robinson | 1,055 | 42.29 | +1.85 | |
Conservative | Lynn Bowen | 966 | 38.72 | +2.74 | |
Labour | Andy Meredith | 474 | 19.00 | +6.11 | |
Turnout | 2,495 | 46.7 | |||
Conservative hold | Swing | -4.26 | |||
Conservative hold | Swing | -5.67 |
Party | Candidate | Votes | % | ±% | |
---|---|---|---|---|---|
Conservative | Simon Bridge | 1,049 | 43.01 | +5.44 | |
Conservative | Graeme Cocker | 1,003 | 41.12 | +1.73 | |
Labour | Richard Thomas Anyon | 387 | 15.87 | +4.09 | |
Turnout | |||||
Conservative hold | Swing | +0.83 | |||
Conservative hold | Swing | -2.36 |
Party | Candidate | Votes | % | ±% | |
---|---|---|---|---|---|
Conservative | Barry Birch | 880 | 38.33 | +1.08 | |
Conservative | Roger Berry | 876 | 38.15 | +1.81 | |
Labour | Chris Frost | 540 | 23.52 | +8.88 | |
Turnout | 2,296 | 49.8 | –19.78 | ||
Conservative hold | Swing | -7.80 | |||
Conservative hold | Swing | -9.94 |
Party | Candidate | Votes | % | ±% | |
---|---|---|---|---|---|
Conservative | John Hodgkinson | 602 | 21.90 | +4.40 | |
Conservative | David John Walmsley | 563 | 20.48 | +2.29 | |
Labour | Bill Glasgow | 486 | 17.68 | +4.32 | |
Labour | Alan Morgan | 462 | 16.81 | +6.28 | |
UKIP | Roy Graham Hopwood | 384 | 13.97 | –2.91 | |
UKIP | Alan Southern | 252 | 9.17 | −5.64 | |
Turnout | 2,749 | 46.4 | |||
Conservative hold | Swing | +3.60 | |||
Conservative hold | Swing | +2.36 |
Party | Candidate | Votes | % | ±% | |
---|---|---|---|---|---|
Labour | Ruth Duffy | 617 | 31.27 | +2.59 | |
Labour | Ian Duffy | 603 | 30.56 | +2.87 | |
Conservative | David Jones | 317 | 16.07 | −6.04 | |
Conservative | Kerry Jones | 259 | 13.13 | −8.39 | |
Independent | Bob Jones | 177 | 8.97 | N/A | |
Turnout | 1,973 | 31.6 | –2.62 | ||
Labour hold | Swing | +9.03 | |||
Labour hold | Swing | +7.92 |
Party | Candidate | Votes | % | ±% | |
---|---|---|---|---|---|
Conservative | Ron Greenhough | 664 | 27.56 | –5.85 | |
Conservative | Ann Margaret Turner | 641 | 26.61 | –4.27 | |
Labour | June Jackson | 568 | 23.58 | +5.31 | |
Labour | Peter Geoffrey Smith | 536 | 22.25 | +4.81 | |
Turnout | 2,409 | 41 | +10.86 | ||
Conservative hold | Swing | -11.16 | |||
Conservative hold | Swing | -9.08 |
Party | Candidate | Votes | % | ±% | |
---|---|---|---|---|---|
Labour | Julie Elizabeth Grunshaw | 694 | 30.29 | +5.07 | |
Labour | Christine Smith | 674 | 29.42 | +6.85 | |
Conservative | Margaret Bond | 503 | 21.96 | −5.96 | |
Conservative | James Robert McConnachie | 420 | 18.33 | −5.96 | |
Turnout | 2,291 | 40.5 | +12.41 | ||
Labour hold | Swing | +7.40 | |||
Labour gain from Conservative | Swing | +12.81 |
Party | Candidate | Votes | % | ±% | |
---|---|---|---|---|---|
Labour | Clive Grunshaw | 919 | 25.42 | +5.20 | |
Labour | Lorraine Beavers | 893 | 24.70 | +4.51 | |
Labour | Ronald Shewan | 825 | 22.82 | +4.28 | |
Conservative | David Charles Shaw | 366 | 10.13 | −2.86 | |
Conservative | Ian McAllister Nicholson | 343 | 9.49 | −3.11 | |
Conservative | Alexander Tomlinson | 269 | 7.44 | −2.25 | |
Turnout | 3,615 | 34.6 | |||
Labour hold | Swing | +8.06 | |||
Labour hold | Swing | +7.62 | |||
Labour hold | Swing | +6.53 |
Party | Candidate | Votes | % | ±% | |
---|---|---|---|---|---|
Conservative | Donald William Lawrenson | 523 | 63.39 | +5.12 | |
Green | Sue White | 173 | 20.97 | N/A | |
Labour | Darrell Stratford Jackson | 129 | 15.64 | N/A | |
Majority | 350 | 42.42 | +25.89 | ||
Turnout | 825 | 47 | +11.79 | ||
Conservative hold | Swing | +25.88 |
Party | Candidate | Votes | % | ±% | |
---|---|---|---|---|---|
Conservative | Gordon McCain | 1,299 | 26.34 | –0.68 | |
Conservative | Vivien Taylor | 1,226 | 24.86 | –2.27 | |
Conservative | Paul Moon | 1,220 | 24.74 | –3.02 | |
Labour | Nic Fogg | 656 | 13.30 | +4.92 | |
UKIP | Christopher Steven Lamb | 530 | 10.75 | N/A | |
Turnout | 4,931 | 47.8 | |||
Conservative hold | Swing | -5.60 | |||
Conservative hold | Swing | -3.31 | |||
Conservative hold | Swing | -4.06 |
Party | Candidate | Votes | % | ±% | |
---|---|---|---|---|---|
Labour | Terry Rogers | 841 | 16.23 | −1.93 | |
Labour | Ted Taylor | 801 | 15.45 | −0.75 | |
Labour | Rita Hewitt | 758 | 14.62 | −2.75 | |
Conservative | Marlene Colby | 698 | 13.47 | −3.90 | |
Conservative | Michelle Riley | 684 | 13.29 | −0.58 | |
Conservative | Keith Riley | 655 | 12.64 | −5.52 | |
UKIP | David Gerrard | 320 | 6.17 | −2.49 | |
UKIP | Jimmy Orange | 233 | 4.50 | N/A | |
Independent | Jack Harrison | 193 | 3.72 | N/A | |
Turnout | 5,183 | 40.7 | |||
Labour hold | Swing | -1.51 | |||
Labour hold | Swing | -0.17 | |||
Labour hold | Swing | -1.52 |
Party | Candidate | Votes | % | ±% | |
---|---|---|---|---|---|
Conservative | Julia Anderson | 1,445 | 26.58 | −2.09 | |
Conservative | Ian Perkin | 1,336 | 24.58 | −2.54 | |
Conservative | Ramesh Gandhi | 1,311 | 24.12 | −2.81 | |
Labour | Eddie Rawlings | 679 | 12.49 | +3.60 | |
Labour | Jonjo O'Connell | 665 | 12.23 | +3.85 | |
Turnout | 5,436 | 45.5 | |||
Conservative hold | Swing | -5.69 | |||
Conservative hold | Swing | -6.39 | |||
Conservative hold | Swing | -6.66 |
Party | Candidate | Votes | % | ±% | |
---|---|---|---|---|---|
Conservative | David Bannister | 928 | 35.29 | −8.03 | |
Conservative | Lesley McKay | 902 | 34.30 | −6.16 | |
Labour | Liam Bromley | 488 | 18.56 | +2.34 | |
Green | Jake Welsh | 312 | 11.86 | N/A | |
Turnout | 2,630 | 46.8 | |||
Conservative hold | Swing | -10.37 | |||
Conservative hold | Swing | -1.80 |
Party | Candidate | Votes | % | ±% | |
---|---|---|---|---|---|
Conservative | Patsy Anne Ormrod | 1,379 | 26.42 | −0.79 | |
Conservative | Michael John Vincent | 1,239 | 23.74 | +0.28 | |
Conservative | Alan Thomas Vincent | 1,223 | 23.43 | +0.27 | |
Labour | Brian Michael Stephenson | 713 | 13.66 | +4.11 | |
Labour | Evelyn Stephenson | 665 | 12.74 | +3.23 | |
Turnout | 5,219 | 44.7 | |||
Conservative hold | Swing | -4.90 | |||
Conservative hold | Swing | -2.95 | |||
Conservative hold | Swing | -5.36 |
Party | Candidate | Votes | % | ±% | |
---|---|---|---|---|---|
Labour | Marge Anderton | 920 | 17.56 | +0.64 | |
Labour | Paul Treece-Birch | 911 | 17.39 | +2.73 | |
Labour | Emma Victoria Anderton | 896 | 17.10 | +3.78 | |
Conservative | Stan Leadbetter | 714 | 13.63 | −4.60 | |
Conservative | Mike Sanderson | 607 | 11.59 | −8.17 | |
Conservative | Bob Long | 466 | 8.90 | −8.20 | |
Independent | Mark Hamer | 389 | 7.43 | N/A | |
Independent | Trisha Hogg | 175 | 3.34 | N/A | |
Independent | Belinda Ann Armstrong | 161 | 3.07 | N/A | |
Turnout | 5,239 | ||||
Labour gain from Conservative | Swing | +8.81 | |||
Labour gain from Conservative | Swing | +7.33 | |||
Labour gain from Conservative | Swing | +11.98 |
Party | Candidate | Votes | % | ±% | |
---|---|---|---|---|---|
Conservative | Val Wilson | 592 | 69.40 | −3.56 | |
Labour | Ben Whittingham | 261 | 30.60 | +3.56 | |
Majority | 331 | 38.80 | −7.12 | ||
Turnout | 853 | ||||
Conservative hold | Swing | -7.12 |
Wyre is a local government district with borough status on the coast of Lancashire, England. The council is based in Poulton-le-Fylde and the borough also contains the towns of Cleveleys, Fleetwood, Garstang, Preesall and Thornton, along with numerous villages and surrounding rural areas. Some of the borough's built-up areas form part of the wider Blackpool urban area. Eastern parts of the borough lie within the Forest of Bowland, a designated Area of Outstanding Natural Beauty.
Blackpool North and Fleetwood is a parliamentary constituency represented in the House of Commons of the Parliament of the United Kingdom, electing one member of parliament (MP) by the first past the post system of election. Since its recreation following the 2023 review of Westminster constituencies for the 2024 general election the seat has been held by Lorraine Beavers of the Labour Party.
Fylde is a constituency in Lancashire which since 2024 has been represented in the House of Commons of the UK Parliament by Andrew Snowden, a Conservative. It is the only Conservative seat in Lancashire after the 2024 General Election, and one of three seats held by the party in North West England overall.
Preston is a constituency represented in the House of Commons of the UK Parliament since 2000 by Sir Mark Hendrick, a member of the Labour Party and Co-operative Party.
Ribble Valley is a constituency in Lancashire represented in the House of Commons of the UK Parliament since 2024 by Maya Ellis, of the Labour Party.
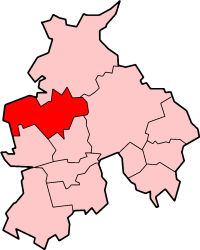
Wyre Borough Council elections are held every four years. Wyre Borough Council is the local authority for the non-metropolitan district of Wyre in Lancashire, England. Since the last boundary changes in 2015, 50 councillors have been elected from 24 wards.
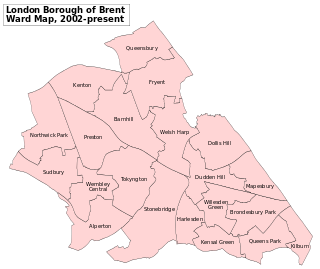
Brent London Borough Council in London, England is elected every four years. Since the last boundary changes in 2022 the council has comprised 57 councillors representing 22 wards, with each ward electing two or three councillors.
Wyre Forest is a local government district in Worcestershire, England. It is named after the ancient woodland of Wyre Forest. The largest town is Kidderminster, where the council is based. The district also includes the towns of Stourport-on-Severn and Bewdley, along with several villages and surrounding rural areas.
Sefton Metropolitan Borough Council elections are generally held three years out of every four, with a third of the council being elected each time. Sefton Metropolitan Borough Council, generally known as Sefton Council, is the local authority for the metropolitan borough of Sefton in Merseyside, England. Since the last boundary changes in 2004, 66 councillors have been elected from 22 wards.
Bridgend County Borough Council is the governing body for Bridgend County Borough, one of the principal areas of Wales.
Great Eccleston is a village and civil parish in Lancashire, England, situated on a coastal plain called the Fylde. The village lies to the south of the River Wyre and the A586 road, approximately 10 miles (16 km) upstream from Fleetwood. At the 2001 census, the parish had a population of 1,473, rising slightly to 1,486 at the 2011 census.
This article lists the British National Party's election results in the UK parliamentary, Scottish parliamentary and Welsh Assembly elections, as well as in the European Parliament elections and at a local level.
Elections to Hammersmith and Fulham Council were held on 4 May 2006. The whole council was up for election for the first time since the 2002 election.
Elections to Wyre Borough Council were held on 3 May 2007. All 55 councillors were elected from 26 wards in elections held every four years. The Conservative Party kept hold overall control of the council.
Elections to Wyre Borough Council were held on 5 May 2003. All 55 councillors were elected from 26 wards in elections held every four years. The Conservative Party kept hold overall control of the council. For this election boundary changes had taken place which resulted in reducing the number of seats by one.
Wandsworth London Borough Council, England, is elected every four years. From 2002 to 2018, 60 councillors were elected from 20 wards. Following ward boundary changes, in 2022 58 councillors were elected in 22 wards returning either 2 or 3 councillors each.
The 2012 Pendle Borough Council election took place on 3 May 2012 to elect members of Pendle Borough Council in Lancashire, England. One third of the council was up for election and the council stayed under no overall control.
Local elections were held for Wyre Borough Council on 7 May 2015, the same day as the 2015 United Kingdom general election and other 2015 United Kingdom local elections. Local elections are held every four years with all councillors up for election in multi-member electoral wards.
The 2015 Wyre Forest District Council election took place on 7 May 2015 to elect members of Wyre Forest District Council in Worcestershire, England. The whole council was up for election after boundary changes reduced the number of seats by nine. The Conservative Party gained overall control of the council from no overall control.
The 2019 United Kingdom local elections took place on Thursday 2 May 2019, with 248 English local councils, six directly elected mayors in England, and all 11 local councils in Northern Ireland being contested.