2011 Kirklees Metropolitan Borough Council election

Last updated

The 2011 Kirklees Metropolitan Borough Council election was held on Thursday 5 May 2011 to elect 23 members to the Kirklees Metropolitan Borough Council, the same day as other local elections in the United Kingdom. It elected one-third of the council's 69 members to a four-year term. The council remained under no overall control. [1]

Contents

Results summary

2011 Kirklees Metropolitan Borough Council election [2] [3] [4]
PartyThis electionFull councilThis election
SeatsNetSeats %OtherTotalTotal %VotesVotes %+/−
  Labour 10Increase2.svg343.5172739.151,14639.7Increase2.svg9.1
  Conservative 8Increase2.svg234.8142231.938,59830.0Increase2.svg0.5
  Liberal Democrats 2Decrease2.svg68.7121420.318,91114.7Decrease2.svg8.7
  Green 2Steady2.svg8.7245.813,23210.3Increase2.svg4.4
  Independent 1Increase2.svg14.3122.93,5332.7Increase2.svg0.3
  TUSC 0Steady2.svg0.0000.01,1800.9Increase2.svg0.2
  UKIP 0Steady2.svg0.0000.09840.8New
  BNP 0Steady2.svg0.0000.09230.7Decrease2.svg6.9
  English Democrat 0Steady2.svg0.0000.02760.2New

Ward results

Almondbury

Almondbury [2] [3] [5]
PartyCandidateVotes%±%
Liberal Democrats James Blanchard 1,736 31.7 Decrease2.svg5.2
Conservative Janice Thomas1,40025.6Decrease2.svg0.1
Labour Elliott Ledsam1,32224.2Increase2.svg10.8
Green Eileen Marchant67712.4Increase2.svg5.9
BNP Tony Leach2304.2Decrease2.svg5.8
TUSC Craig Fennell1051.9New
Majority3366.1Decrease2.svg5.1
Total valid votes5,47040.9
Registered electors 13,542
Liberal Democrats hold Swing Decrease2.svg2.6

Ashbrow

Ashbrow [2] [3] [5]
PartyCandidateVotes%±%
Labour Cath Harris* 2,817 52.5 Increase2.svg11.1
Conservative Bill Armer1,87134.8Increase2.svg3.6
Liberal Democrats Manjit Singh3977.4Decrease2.svg0.6
Green Sharon Fallows2855.3Decrease2.svg0.3
Majority94617.6Increase2.svg7.4
Total valid votes5,39539.7
Registered electors 13,791
Labour hold Swing Increase2.svg3.8

Batley East

Batley East [2] [3] [5]
PartyCandidateVotes%±%
Labour Amanda Stubley 3,834 67.2 Increase2.svg18.5
Conservative Mohammed Laher1,02818.0Increase2.svg3.1
Liberal Democrats Jon Bloom3335.8Decrease2.svg14.2
Independent Mark Griffin2955.2New
Green Peter Cunnington2123.7Increase2.svg0.5
Majority2,80649.2Increase2.svg39.0
Total valid votes5,70245.5
Registered electors 12,804
Labour hold Swing Increase2.svg7.7

Batley West

Batley West [2] [3] [5]
PartyCandidateVotes%±%
Labour Peter O'Neill* 3,376 64.3 Increase2.svg24.9
Conservative John Birkenshaw1,30224.8Increase2.svg4.6
Green Matt Blakeley3176.0Increase2.svg2.1
Liberal Democrats Irfan Iqbal2524.8Decrease2.svg13.3
Majority2,07439.5Increase2.svg20.3
Total valid votes5,24740.5
Registered electors 13,157
Labour hold Swing Increase2.svg10.2

Birstall and Birkenshaw

Birstall and Birkenshaw [2] [3] [5]
PartyCandidateVotes%±%
Conservative Robert Light* 2,642 53.2 Increase2.svg5.0
Labour Michael Williams1,64033.0Increase2.svg9.6
Green Clive Lord3687.4Increase2.svg2.1
Liberal Democrats Suzy Brain England3176.4Increase2.svg0.4
Majority1,00220.2Decrease2.svg4.6
Total valid votes4,96740.9
Registered electors 12,503
Conservative hold Swing Decrease2.svg2.3

Cleckheaton

Cleckheaton [2] [3] [5]
PartyCandidateVotes%±%
Liberal Democrats Andrew Pinnock* 2,237 42.8 Decrease2.svg4.3
Conservative David Pinder1,38926.6Increase2.svg10.7
Labour Dan Howard1,31625.2Increase2.svg17.1
Green Robert Barraclough2835.4Increase2.svg3.7
Majority84816.2Decrease2.svg3.8
Total valid votes5,22541.3
Registered electors 12,856
Liberal Democrats hold Swing Decrease2.svg7.5

Colne Valley

Colne Valley [2] [3] [5]
PartyCandidateVotes%±%
Conservative Donna Bellamy 1,656 28.9 Increase2.svg9.7
Labour Tabatha Ellam1,55427.1Increase2.svg14.9
Liberal Democrats Lynn Bradbury1,42524.8Decrease2.svg17.8
Green Chayley Collis5599.7Increase2.svg0.6
UKIP Melanie Roberts5439.5New
Majority1021.8N/A
Total valid votes5,77143.8
Registered electors 13,273
Conservative gain from Liberal Democrats Swing Decrease2.svg2.6

Crosland Moor and Netherton

Crosland Moor and Netherton [2] [3] [5]
PartyCandidateVotes%±%
Labour Mohammad Sarwar* 2,754 47.0 Increase2.svg9.5
Conservative Louisa Waple1,15119.7Increase2.svg8.7
TUSC Jackie Grunsell86614.8New
Liberal Democrats Mahmood Hussain5749.8Decrease2.svg6.8
Green Chas Ball5118.7Increase2.svg4.7
Majority1,60327.4Increase2.svg12.2
Total valid votes5,85645.1
Registered electors 13,196
Labour hold Swing Increase2.svg0.4

Dalton

Dalton [2] [3] [5]
PartyCandidateVotes%±%
Labour Cliff Preest 2,243 48.0 Increase2.svg18.9
Liberal Democrats Roger Battye*1,07222.9Decrease2.svg12.1
Conservative Chris Meadows89219.1Increase2.svg3.4
Green David Honour46810.0Increase2.svg5.3
Majority1,17125.0N/A
Total valid votes4,67537.2
Registered electors 12,758
Labour gain from Liberal Democrats Swing Increase2.svg15.5

Denby Dale

Denby Dale [2] [3] [5]
PartyCandidateVotes%±%
Conservative Elaine Ward* 2,514 41.1 Decrease2.svg0.2
Labour Graham Turner2,28537.4Increase2.svg7.3
Green Terry Sigsworth4437.2Steady2.svg
Liberal Democrats Craig Armistead3926.4Decrease2.svg1.9
English Democrat Paul McEnhill2764.5Decrease2.svg1.5
BNP Rachel Firth2063.4Decrease2.svg3.6
Majority2293.7Decrease2.svg7.5
Total valid votes6,14049.0
Registered electors 12,663
Conservative hold Swing Decrease2.svg3.8

Dewsbury East

Dewsbury East [2] [3] [5]
PartyCandidateVotes%±%
Labour Eric Firth* 2,739 51.6 Increase2.svg15.5
Conservative Mark Eastwood1,15021.7Increase2.svg15.3
Liberal Democrats Dennis Hullock77614.6Decrease2.svg6.7
UKIP Greg Burrows4418.3New
Green Tony Kelsall2033.8Increase2.svg2.3
Majority1,58929.9Increase2.svg28.5
Total valid votes5,30940.0
Registered electors 13,486
Labour hold Swing Increase2.svg0.1

Dewsbury South

Dewsbury South [2] [3] [5]
PartyCandidateVotes%±%
Conservative Salim Patel* 2,577 43.0 Increase2.svg9.3
Labour Naheed Arshad-Mather1,89631.6Increase2.svg0.1
Independent Chris Kennedy82213.7New
Green Adrian Cruden2874.8Increase2.svg0.5
Liberal Democrats Bernard Disken2243.7Decrease2.svg1.7
Independent Shaun Maddox1893.2New
Majority68111.4Increase2.svg9.2
Total valid votes5,99547.4
Registered electors 12,890
Conservative hold Swing Increase2.svg4.6

Dewsbury West

Dewsbury West [2] [3] [5]
PartyCandidateVotes%±%
Labour Darren O'Donovan 2,918 50.8 Increase2.svg20.9
Liberal Democrats Naz Hussain*2,11836.9Decrease2.svg9.3
Conservative Christophe Walker5028.7Increase2.svg3.4
Green Andrew Stimson2023.5Increase2.svg1.5
Majority80013.9N/A
Total valid votes5,74045.2
Registered electors 12,971
Labour gain from Liberal Democrats Swing Increase2.svg15.1

Golcar

Golcar [2] [3] [5]
PartyCandidateVotes%±%
Labour Hilary Richards 1,769 33.6 Increase2.svg13.1
Liberal Democrats Robert Iredale*1,56729.7Decrease2.svg9.8
Conservative Clinton Simpson85716.3Increase2.svg4.4
Green Daniel Greenwood3847.3Increase2.svg1.2
Independent David Hill3406.5New
BNP Skye Turner2925.5Decrease2.svg16.6
TUSC Matt Moll591.1New
Majority2023.8N/A
Total valid votes5,29239.4
Registered electors 13,559
Labour gain from Liberal Democrats Swing Increase2.svg11.5

Greenhead

Greenhead [2] [3] [5]
PartyCandidateVotes%±%
Labour Judith Hughes 4,117 65.0 Increase2.svg5.9
Conservative Robert McGuin97215.3Increase2.svg1.5
Liberal Democrats Mohammed Haleem71811.3Increase2.svg2.6
Green Michelle Atkinson5268.3Decrease2.svg1.2
Majority3,14549.7Increase2.svg4.4
Total valid votes6,37946.2
Registered electors 13,949
Labour hold Swing Increase2.svg2.2

Heckmondwike

Heckmondwike [2] [3] [5]
PartyCandidateVotes%±%
Labour Paul Sheard* 3,403 70.1 Increase2.svg25.4
Conservative Mark Roberts87318.0Increase2.svg1.8
Green David Brooks3206.6New
Liberal Democrats Josie Pugsley2575.3Decrease2.svg1.2
Majority2,53052.1Increase2.svg40.0
Total valid votes4,85338.9
Registered electors 12,699
Labour hold Swing Increase2.svg11.8

Holme Valley North

Holme Valley North [2] [3] [5]
PartyCandidateVotes%±%
Independent Edgar Holroyd-Doveton 1,887 31.7 New
Conservative Basil Smith1,53925.8Decrease2.svg0.5
Liberal Democrats David Woodhead*1,09718.4Decrease2.svg9.5
Labour Ian Leedham93115.6Increase2.svg6.7
Green Barry Ward5078.5Increase2.svg2.8
Majority3485.8N/A
Total valid votes5,96147.7
Registered electors 12,665
Independent gain from Liberal Democrats Swing Increase2.svg16.1

Holme Valley South

Holme Valley South [2] [3] [5]
PartyCandidateVotes%±%
Conservative Ken Sims* 3,201 48.8 Decrease2.svg0.2
Labour Steven Morris1,80827.6Increase2.svg10.7
Green Sue Macklin79412.1Decrease2.svg1.7
Liberal Democrats Oliver Constance75111.5Decrease2.svg1.1
Majority1,39321.3Decrease2.svg10.8
Total valid votes6,60446.6
Registered electors 14,360
Conservative hold Swing Decrease2.svg5.5

Kirkburton

Kirkburton [2] [3] [5]
PartyCandidateVotes%±%
Green Derek Hardcastle* 2,221 38.8 Decrease2.svg4.6
Conservative Amanda Shaw2,13937.4Increase2.svg2.8
Labour Mike Greetham1,04018.2Increase2.svg7.0
BNP Carol Dixon1953.4Decrease2.svg2.4
Liberal Democrats Jatinder Singh1272.2Decrease2.svg1.0
Majority821.4Decrease2.svg7.4
Total valid votes5,74744.8
Registered electors 12,888
Green hold Swing Decrease2.svg3.7

Lindley

Lindley [2] [3] [5]
PartyCandidateVotes%±%
Conservative Tony Brice 2,379 39.3 Increase2.svg9.5
Liberal Democrats Anthony Woodhead*1,65027.3Decrease2.svg14.6
Labour Douglas Morgan1,48724.6Increase2.svg12.0
Green Richard Plunkett5318.8Increase2.svg2.8
Majority72912.1N/A
Total valid votes6,08144.0
Registered electors 13,936
Conservative gain from Liberal Democrats Swing Increase2.svg12.1

Liversedge and Gomersal

Liversedge and Gomersal [2] [3] [5]
PartyCandidateVotes%±%
Conservative Lisa Holmes 2,467 46.7 Increase2.svg5.2
Labour Gordon North2,18941.5Increase2.svg22.1
Green Karen Allison3346.3Increase2.svg2.3
Liberal Democrats Richard Farnhill2905.5Decrease2.svg2.0
Majority2785.3Decrease2.svg8.6
Total valid votes5,28039.0
Registered electors 13,735
Conservative hold Swing Decrease2.svg8.5

Mirfield

Mirfield [2] [3] [5]
PartyCandidateVotes%±%
Conservative Kathleen Taylor* 3,561 53.9 Increase2.svg7.2
Labour Karen Rowling2,32535.2Increase2.svg20.8
Liberal Democrats Brian Firth3765.7Steady2.svg
Green Cassandra Whittingham3505.3Increase2.svg2.4
Majority1,23618.7Decrease2.svg3.9
Total valid votes6,61244.5
Registered electors 15,089
Conservative hold Swing Decrease2.svg6.8

Newsome

Newsome [2] [3] [5]
PartyCandidateVotes%±%
Green Julie Stewart-Turner* 2,450 51.6 Decrease2.svg1.1
Labour Mohammed Saeed1,38329.2Increase2.svg3.0
Conservative Jas Virdee53611.3Decrease2.svg2.4
Liberal Democrats Philip Scott2254.7Decrease2.svg2.8
TUSC Ian Slattery1503.2New
Majority1,06722.5Decrease2.svg4.0
Total valid votes4,77734.6
Registered electors 13,955
Green hold Swing Decrease2.svg2.1

Related Research Articles

<span class="mw-page-title-main">1998 Bolton Metropolitan Borough Council election</span>

The 1998 Bolton Metropolitan Borough Council election took place on 7 May 1998 to elect members of Bolton Metropolitan Borough Council in Greater Manchester, England. One third of the council was up for election and the Labour Party kept overall control of the council.

<span class="mw-page-title-main">Dorset County Council elections</span> Local government elections in Dorset, England

Dorset County Council was a non-metropolitan county in England. Elections were first held on 23 January 1889, thereafter elections were held every three years, with all members being elected by the first past the post system of election on the same day. Later, the cycle was changed to one election in every four years, and the last such election was in 2017. There were also occasional by-elections, the last of which took place in December 2016.

The 2012 Tamworth Borough Council election was held on 3 May 2012 to elect members of the Tamworth Borough Council. Ten seats were up for grabs; the Labour Party won 60% of the seats with 48.70% of the vote. The Labour Party became the majority in the council after a Conservative win in 2011.

<span class="mw-page-title-main">1983 Bolton Metropolitan Borough Council election</span> 1983 UK local government election

The 1983 Bolton Metropolitan Borough Council election took place on 5 May 1983 to elect members of Bolton Metropolitan Borough Council in Greater Manchester, England. One third of the council was up for election and the Labour Party kept overall control of the council

<span class="mw-page-title-main">1986 Bolton Metropolitan Borough Council election</span> 1986 UK local government election

The 1986 Bolton Metropolitan Borough Council election took place on 8 May 1986 to elect members of Bolton Metropolitan Borough Council in Greater Manchester, England. One third of the council was up for election and the Labour Party kept overall control of the council.

<span class="mw-page-title-main">1987 Bolton Metropolitan Borough Council election</span> 1987 UK local government election

The 1987 Bolton Metropolitan Borough Council election took place on 7 May 1987 to elect members of Bolton Metropolitan Borough Council in Greater Manchester, England. One third of the council was up for election and the Labour Party kept overall control of the council.

<span class="mw-page-title-main">1988 Bolton Metropolitan Borough Council election</span> 1988 UK local government election

The 1988 Bolton Metropolitan Borough Council election took place on 5 May 1988 to elect members of Bolton Metropolitan Borough Council in Greater Manchester, England. One third of the council was up for election and the Labour Party kept overall control of the council.

<span class="mw-page-title-main">1994 Bolton Metropolitan Borough Council election</span> 1994 UK local government election

The 1994 Bolton Metropolitan Borough Council election took place on 5 May 1994 to elect members of Bolton Metropolitan Borough Council in Greater Manchester, England. One third of the council was up for election and the Labour Party kept overall control of the council.

<span class="mw-page-title-main">1973 Bolton Metropolitan Borough Council election</span> 1973 UK local government election

The first elections to Bolton Metropolitan Borough Council were held on Thursday, 10 May 1973, with the entirety of the 69 seat council - three seats for each of the 23 wards - up for vote. It was the first council election as the newly formed metropolitan borough under a new constitution. The Local Government Act 1972 stipulated that the elected members were to shadow and eventually take over from the County Borough of Bolton, the Municipal Borough of Farnworth, the Urban Districts of Blackrod, Horwich, Kearsley, Little Lever, and Westhoughton, and the southern part of Turton Urban District on 1 April 1974. The order in which the councillors were elected dictated their term serving, with third-place candidates serving two years and up for re-election in 1975, second-placed three years expiring in 1976 and 1st-placed five years until 1978.

The 1996 North Tyneside Metropolitan Borough Council election to the North Tyneside Metropolitan Borough Council was held on 2 May 1996 alongside other local elections. Labour held control of the council after the elections, gaining seats from the Conservatives, matching the national trend.

The 1999 North Tyneside Metropolitan Borough Council election to the North Tyneside Metropolitan Borough Council were held in 1999 alongside other local elections. Labour held control of the council after the election.

<span class="mw-page-title-main">2006 Stockport Metropolitan Borough Council election</span> 2006 local election in England, UK

The 2006 Stockport Metropolitan Borough Council election took place on 4 May 2006 to elect members of Stockport Metropolitan Borough Council in England. This was on the same day as other local elections. One third of the council was up for election, with each successful candidate serving a four-year term of office, expiring in 2010. The Liberal Democrats held overall control of the council.

<span class="mw-page-title-main">Oxton (ward)</span>

Oxton is a Wirral Metropolitan Borough Council ward in the Birkenhead Parliamentary constituency.

<span class="mw-page-title-main">Bebington (ward)</span>

Bebington is a ward of Wirral Metropolitan Borough Council in the Birkenhead Parliamentary constituency.

<span class="mw-page-title-main">2007 North Warwickshire Borough Council election</span> 2007 UK local government election

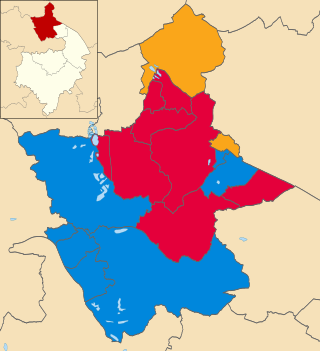
On 3 May 2007, an election was held to elect councillors to the North Warwickshire Borough Council on the same day as other local elections in the UK. It resulted in the Conservative Party gaining control of the council. The previous election resulted in no overall control with the Labour Party having the highest number of seats at 16.
<span class="mw-page-title-main">2003 North Warwickshire Borough Council election</span> 2003 UK local government election

On 1 May 2003, an election was held to elect councillors to the North Warwickshire Borough Council on the same day as other local elections in the UK. It was the first election to take place under the new ward boundaries, with one extra seat from the previous 34 seats added. All 35 seats were up for election and the result was no overall control with the Labour Party having the most seats at 16. The previous election had resulted in the council being controlled by Labour.

<span class="mw-page-title-main">1999 North Warwickshire Borough Council election</span> 1999 UK local government election

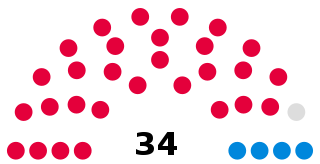
On 6 May 1999, an election was held to elect councillors to the North Warwickshire Borough Council on the same day as other local elections in the UK. It resulted in the Labour Party keeping control of the council. All 34 seats were up for election in all wards.
<span class="mw-page-title-main">1995 North Warwickshire Borough Council election</span> 1995 UK local government election

An election was held on 4 May 1995 to elect all 34 members of the North Warwickshire Borough Council in England. It resulted in the Labour Party retaining control of the council.

The 2011 Tamworth Borough Council election was held on 5 May 2011 to elect members of the Tamworth Borough Council. Ten seats were up for grabs; the Conservative Party won 75% of them with 48.70% of the votes.

The 2011 Woking Borough District Council election was held on 5 May 2011 to elect members of the Woking Borough Council of the 13 open seats, the Conservative Party won 9 with 49.30% of the vote.

References

  1. Tetteh, Edmund (24 May 2011). "Local elections 2011" (PDF). The House of Commons Library. Retrieved 15 July 2024.
  2. 1 2 3 4 5 6 7 8 9 10 11 12 13 14 15 16 17 18 19 20 21 22 23 24 Teale, Andrew. "Local Election Results 2011 - Kirklees". Local Elections Archive Project. Retrieved 15 July 2024.
  3. 1 2 3 4 5 6 7 8 9 10 11 12 13 14 15 16 17 18 19 20 21 22 23 24 Rallings, Colin; Thrasher, Michael. "Local Elections Handbook 2011" (PDF). The Elections Centre. Retrieved 15 July 2024.
  4. Rallings, Colin; Thrasher, Michael. "Kirklees Metropolitan Council Election Results 1973-2012" (PDF). The Elections Centre. Retrieved 15 July 2024.
  5. 1 2 3 4 5 6 7 8 9 10 11 12 13 14 15 16 17 18 19 20 21 22 23 "District council election results, 5 May 2011". Kirklees Council. Retrieved 15 July 2024.