This article needs additional citations for verification .(February 2024) |
Elections to North Tyneside Metropolitan Council took place on 5 May 2011 on the same day as other council elections in England and the UK AV referendum.
North Tyneside Council is elected "in thirds" which means one councillor from each three-member ward is elected each year with a fourth year when the mayoral election takes place.
One third of the councillors were elected in 2007. The Labour Party gained 6 seats, and lost none. giving them an overall majority of councillors. The Conservative Party remain in control however as the mayor continues to be Linda Arkley. Arkley now has to seek the support of other parties to get her budget passed as the Conservatives lost 5 seats and the 20 seats required to pass such legislature. The Liberal Democrats also lost one seat for the second consecutive year. Labour won 14 seats in 2010 and 2011 combined, with the Conservative losing 12, switching the balance of power in the council chamber.
Party | Seats | Gains | Losses | Net gain/loss | Seats % | Votes % | Votes | +/− | |
---|---|---|---|---|---|---|---|---|---|
Labour | 35 | 6 | 0 | +6 | 58.3 | 54.3 | 35,226 | +4.2% | |
Conservative | 19 | 0 | 5 | -5 | 31.7 | 33.6 | 21,806 | +1.1% | |
Liberal Democrats | 6 | 0 | 1 | -1 | 10 | 10.4 | 6,749 | -4.7% | |
National Front | 0 | 0 | 0 | 0 | 0 | 0.75 | 503 | +0.18% | |
Green | 0 | 0 | 0 | 0 | 0 | 0.54 | 349 | -0.76% | |
Independent | 0 | 0 | 0 | 0 | 0 | 0.29 | 187 | +0.29% | |
BNP | 0 | 0 | 0 | 0 | 0 | 0.15 | 96 | -1.05% | |
Party | Candidate | Votes | % | ±% | |
---|---|---|---|---|---|
Labour | Lesley Spillard | 1,962 | 63.8 | +17 | |
Liberal Democrats | Dorothy Bradley | 1,133 | 36.2 | -5.2 | |
Majority | 829 | 27 | +21.6 | ||
Turnout | 3,075 | 37.7 | -23.5 | ||
Labour hold | Swing | +11.1 | |||
Party | Candidate | Votes | % | ±% | |
---|---|---|---|---|---|
Labour | Janet Hunter | 2,060 | 53.9 | +7.3 | |
Conservative | John Goodfellow | 1,613 | 42.2 | +7.9 | |
Liberal Democrats | Bob Watson | 149 | 3.9 | -15.2 | |
Majority | 447 | 11.7 | -0.6 | ||
Turnout | 3,822 | 49 | -17.7 | ||
Labour gain from Conservative | Swing | -0.3 | |||
Party | Candidate | Votes | % | ±% | |
---|---|---|---|---|---|
Labour | Ray Glindon | 1,946 | 76.1 | +17.6 | |
Conservative | Ray Taylor | 612 | 23.9 | +6.1 | |
Majority | 1,334 | 40.7 | +11.6 | ||
Turnout | 2,558 | 33 | -25.1 | ||
Labour hold | Swing | +5.8 | |||
Party | Candidate | Votes | % | ±% | |
---|---|---|---|---|---|
Labour | David Corkey | 1,841 | 76.1 | -1.3 | |
Conservative | Sue Rodgerson | 579 | 23.9 | +1.3 | |
Majority | 1,260 | 52.1 | -2.6 | ||
Turnout | 2,420 | 29.5 | -23.8 | ||
Labour hold | Swing | -1.3 | |||
Party | Candidate | Votes | % | ±% | |
---|---|---|---|---|---|
Labour | Martin Rankin | 2,106 | 62.2 | 0 | |
Conservative | Paul Bunyan | 1,136 | 33.5 | -4.3 | |
Liberal Democrats | Norma Playle | 146 | 4.3 | +4.3 | |
Majority | 750 | 22.1 | +2 | ||
Turnout | 3,388 | 42.5 | -22.8 | ||
Labour gain from Conservative | Swing | +2.2 | |||
Party | Candidate | Votes | % | ±% | |
---|---|---|---|---|---|
Conservative | George Westwater | 1,995 | 52 | +3.8 | |
Labour | Ron Bales | 1,838 | 48 | +5.2 | |
Majority | 157 | 4.1 | -1.3 | ||
Turnout | 3,833 | 51.7 | -24.3 | ||
Conservative hold | Swing | -0.7 | |||
Party | Candidate | Votes | % | ±% | |
---|---|---|---|---|---|
Labour | John Harrison | 1,884 | 72 | +15.7 | |
Liberal Democrats | Paul Moat | 437 | 16.7 | -9 | |
National Front | Roger Batten | 295 | 11.3 | +3.4 | |
Majority | 1,447 | 55.3 | +24.7 | ||
Turnout | 2,616 | 31.2 | -25.1 | ||
Labour hold | Swing | +12.4 | |||
Party | Candidate | Votes | % | ±% | |
---|---|---|---|---|---|
Labour | Alison Waggot-Fairley | 1,872 | 56.7 | +6.9 | |
Conservative | Nigel Clothier | 1,259 | 38.2 | +6.2 | |
Liberal Democrats | Thomas Barton | 169 | 5.1 | -13.1 | |
Majority | 613 | 18.6 | +0.8 | ||
Turnout | 3,300 | 41.9 | -23.6 | ||
Labour gain from Conservative | Swing | +0.4 | |||
Party | Candidate | Votes | % | ±% | |
---|---|---|---|---|---|
Labour | Kevin Conroy | 2,029 | 72 | +18 | |
Conservative | Robin Underwood | 544 | 19.6 | +3.9 | |
National Front | Mark Nicholls | 208 | 7.5 | +3 | |
Majority | 1,485 | 53.4 | +19.8 | ||
Turnout | 2,781 | 34.7 | -22.8 | ||
Labour hold | Swing | +7.1 | |||
Party | Candidate | Votes | % | ±% | |
---|---|---|---|---|---|
Conservative | Paul Mason | 1,943 | 56.5 | +9.9 | |
Labour | Glenn Stillaway | 1,201 | 34.9 | +1.9 | |
Liberal Democrats | David Nisbet | 296 | 8.6 | -11.9 | |
Majority | 742 | 21.6 | +8 | ||
Turnout | 3,440 | 49.9 | -26.6 | ||
Conservative hold | Swing | +4 | |||
Party | Candidate | Votes | % | ±% | |
---|---|---|---|---|---|
Labour | Bill Caithness | 1,863 | 50 | +6.6 | |
Conservative | Ken Mewett | 1,580 | 42.4 | +2.4 | |
Liberal Democrats | Charles Hall | 280 | 7.5 | -8.2 | |
Majority | 283 | 7.6 | -1.9 | ||
Turnout | 3,723 | 49.3 | -32 | ||
Labour gain from Conservative | Swing | +2.1 | |||
Party | Candidate | Votes | % | ±% | |
---|---|---|---|---|---|
Liberal Democrats | David Ord | 2,035 | 57.4 | +6.7 | |
Labour | Malcolm Redhead | 1,509 | 42.6 | +5 | |
Majority | 385 | 10.9 | -2.2 | ||
Turnout | 3,544 | 38.1 | -21.2 | ||
Liberal Democrats hold | Swing | +0.9 | |||
Party | Candidate | Votes | % | ±% | |
---|---|---|---|---|---|
Conservative | David Sarin | 1,654 | 50.7 | +2.4 | |
Labour | Catherine Blyth | 1,465 | 44.9 | -6.8 | |
Liberal Democrats | Wil Taylor | 153 | 4.7 | +4.7 | |
Majority | 189 | 5.8 | +2.5 | ||
Turnout | 3,263 | 46.9 | -24.5 | ||
Conservative hold | Swing | +4.6 | |||
Party | Candidate | Votes | % | ±% | |
---|---|---|---|---|---|
Labour | Norma Redfearn | 1,775 | 71.2 | +16.6 | |
Conservative | Matt Galley | 442 | 17.9 | -1.5 | |
Liberal Democrats | Andy Hudson | 249 | 10.1 | -15.9 | |
Majority | 1,333 | 54.1 | +25.5 | ||
Turnout | 2,466 | 31.1 | -19.9 | ||
Labour hold | Swing | +9.1 | |||
Party | Candidate | Votes | % | ±% | |
---|---|---|---|---|---|
Conservative | Ed Hodson | 2,820 | 70.1 | +2.7 | |
Labour | Simon Philpott | 784 | 19.5 | -5.6 | |
Liberal Democrats | Michael Day | 214 | 5.3 | +5.3 | |
Green | Julia Erskine | 206 | 5.1 | -2.4 | |
Majority | 2,036 | 50.6 | +8.2 | ||
Turnout | 4,024 | 59.1 | -19.7 | ||
Conservative hold | Swing | +4.2 | |||
Party | Candidate | Votes | % | ±% | |
---|---|---|---|---|---|
Conservative | Jean McLaughlin | 2,029 | 49.9 | +1.1 | |
Labour | Jeffrey Maughan | 1,787 | 44 | -7.2 | |
Liberal Democrats | Clare Barton | 248 | 6.1 | +6.1 | |
Majority | 242 | 6 | +3.6 | ||
Turnout | 4,064 | 48.8 | -23.5 | ||
Conservative hold | Swing | +4.2 | |||
Party | Candidate | Votes | % | ±% | |
---|---|---|---|---|---|
Labour | Carole Gambling | 2,064 | 75.7 | +12.5 | |
Conservative | Leon Rodda | 661 | 24.3 | -1.7 | |
Majority | 1,403 | 51.5 | +14.3 | ||
Turnout | 2,725 | 34 | -27 | ||
Labour hold | Swing | +7.1 | |||
Party | Candidate | Votes | % | ±% | |
---|---|---|---|---|---|
Labour | Jules Rutherford | 1,532 | 52.4 | +12.9 | |
Liberal Democrats | Nigel Huscroft | 1,061 | 36.3 | -8.7 | |
Independent | Alan Ma | 187 | 6.4 | +6.4 | |
Green | Martin Collins | 143 | 4.9 | -0.1 | |
Majority | 471 | 16.1 | +10.5 | ||
Turnout | 2,923 | 37.6 | -20 | ||
Labour gain from Liberal Democrats | Swing | +10.8 | |||
Party | Candidate | Votes | % | ±% | |
---|---|---|---|---|---|
Labour | Muriel Green | 2,196 | 59.4 | +0.8 | |
Conservative | Andrew Elliott | 1,498 | 40.6 | -0.8 | |
Majority | 698 | 18.9 | +1.6 | ||
Turnout | 3,694 | 48.8 | -18.5 | ||
Labour hold | Swing | +0.8 | |||
Party | Candidate | Votes | % | ±% | |
---|---|---|---|---|---|
Labour | John O'Shea | 1,512 | 46.8 | +7.4 | |
Conservative | Alison Austin | 1,441 | 44.6 | +7.7 | |
Liberal Democrats | John Appleby | 179 | 5.5 | -14.9 | |
BNP | Dorothy Brooke | 96 | 3 | -0.3 | |
Majority | 71 | 2.2 | -0.2 | ||
Turnout | 3,228 | 45.3 | -24.5 | ||
Labour gain from Conservative | Swing | -0.2 | |||
North Tyneside is a metropolitan borough in the metropolitan county of Tyne and Wear, England. It forms part of the greater Tyneside conurbation. North Tyneside Council is headquartered at Cobalt Park, Wallsend.
Linda Arkley was a British Conservative politician who served as the elected Mayor of North Tyneside from 2003 to 2005 and from 2009 to 2013.
Tynemouth is a constituency in Tyne and Wear represented in the House of Commons of the UK Parliament since 1997 by Sir Alan Campbell, a member of the Labour Party.
Chris Morgan was a British Conservative Party politician. He served as Mayor of North Tyneside, England, from his election in May 2002 until he resigned in April 2003.
John Harrison is a British Labour Party politician. He was the directly-elected Mayor of North Tyneside in England between 2005 and 2009 and is currently a Councillor on North Tyneside Council.
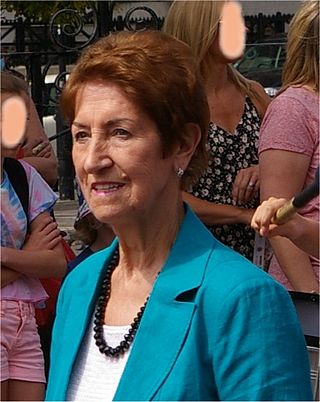
Dame Norma Redfearn is a Labour politician currently serving as the directly-elected Mayor of North Tyneside.
The city of Bristol, England, is a unitary authority, represented by four MPs representing seats wholly within the city boundaries. As well as these, Filton and Bradley Stoke covers the northern urban fringe in South Gloucestershire and the north eastern urban fringe is in the Kingswood constituency. The overall trend of both local and national representation became left of centre during the latter 20th century, but there was a shift to the right in the 2010 general election. The city has a tradition of local activism, with environmental issues and sustainable transport being prominent issues in the city.
Elections to North Tyneside Metropolitan Council took place on 3 May 2007 on the same day as other local council elections in England.
Elections to North Tyneside Metropolitan Council took place on 1 May 2003 on the same day as other local council elections in England.
Elections to North Tyneside Metropolitan Council took place on 1 May 2008 on the same day as other local council elections in England.
Elections to North Tyneside Metropolitan Council took place on 6 May 2010 on the same day as other council elections in England and the UK general election.
The 2004 South Tyneside Metropolitan Borough Council election took place on 10 June 2004 to elect members of South Tyneside Metropolitan Borough Council in Tyne and Wear, England. The whole council was up for election with boundary changes since the last election in 2003 reducing the number of seats by 6. The Labour Party stayed in overall control of the council.
The 2013 United Kingdom local elections took place on Thursday 2 May 2013. Elections were held in 35 English councils: all 27 non-metropolitan county councils and eight unitary authorities, and in one Welsh unitary authority. Direct mayoral elections took place in Doncaster and North Tyneside. These elections last took place on the 4 June 2009 at the same time as the 2009 European Parliament Elections, except for County Durham, Northumberland and the Anglesey where elections last took place in 2008.
North Tyneside Council is the local authority for the metropolitan borough of North Tyneside in Tyne and Wear, England. It is one of five such councils in Tyne and Wear, and one of 36 in England. It provides the majority of local government services in North Tyneside.
Elections to North Tyneside Metropolitan Council took place on 22 May 2014. They coincided with other local elections happening in the UK that day, as well as the 2014 election to the European Parliament.
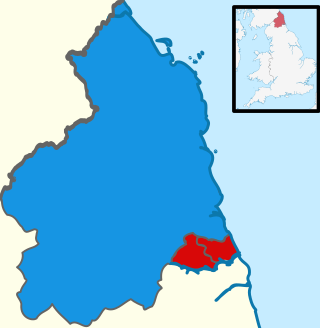
The inaugural North of Tyne mayoral election was held on 2 May 2019 to elect the first Mayor of the North of Tyne. The area is made up of Newcastle upon Tyne, North Tyneside and Northumberland. Subsequent elections will be held every five years.
The 2022 North Tyneside Metropolitan Borough Council election took place on 5 May 2022. One third of councillors—20 out of 60—on North Tyneside Metropolitan Borough Council were elected. The election took place alongside other local elections across the United Kingdom.
The 2022 South Tyneside Metropolitan Borough Council election took place on 5 May 2022 to elect members of South Tyneside Council. This was on the same day as other local elections. 19 of the 54 seats were up for election, with 1 ward (Harton) electing 2 councillors.
The 2023 North Tyneside Metropolitan Borough Council elections were held on 4 May 2023 alongside other local elections in the United Kingdom. One third of the seats on the council were contested at this election. Labour retained its majority on the council.
The 2024 North Tyneside Metropolitan Borough Council election is scheduled to be held on Thursday 2 May 2024, alongside the other local elections held in the United Kingdom on the same day.
Preceded by 2010 North Tyneside Council election | North Tyneside local elections | Succeeded by 2012 North Tyneside Council election |