| ||||||||||||||||||||||||||||||||||||||||
All 25 seats to North Down Borough Council 13 seats needed for a majority | ||||||||||||||||||||||||||||||||||||||||
---|---|---|---|---|---|---|---|---|---|---|---|---|---|---|---|---|---|---|---|---|---|---|---|---|---|---|---|---|---|---|---|---|---|---|---|---|---|---|---|---|
| ||||||||||||||||||||||||||||||||||||||||
Party with the most votes by district. |
Elections to North Down Borough Council were held on 5 May 2011 on the same day as the other Northern Irish local government elections. The election used four district electoral areas to elect a total of 25 councillors.
Party | Seats | Gains | Losses | Net gain/loss | Seats % | Votes % | Votes | +/− | |
---|---|---|---|---|---|---|---|---|---|
DUP | 11 | 3 | 0 | 3 | 44.0 | 36.2 | 9,031 | 4.8 | |
Alliance | 6 | 0 | 0 | 0 | 24.0 | 18.3 | 4,561 | 2.3 | |
UUP | 4 | 0 | 4 | 4 | 16.0 | 13.9 | 3,472 | 7.6 | |
Independent | 3 | 1 | 0 | 1 | 12.0 | 18.4 | 4,583 | 7.3 | |
Green (NI) | 1 | 1 | 1 | 0 | 4.0 | 7.4 | 1,834 | 1.0 | |
NI Conservatives | 0 | 0 | 0 | 0 | 0.0 | 2.9 | 727 | 1.6 | |
UKIP | 0 | 0 | 0 | 0 | 0.0 | 1.7 | 427 | New | |
SDLP | 0 | 0 | 0 | 0 | 0.0 | 1.2 | 298 | 0.7 |
Note: "Votes" are the first preference votes.
Ward | % | Cllrs | % | Cllrs | % | Cllrs | % | Cllrs | % | Cllrs | Total Cllrs |
---|---|---|---|---|---|---|---|---|---|---|---|
DUP | Alliance | UUP | Green | Others | |||||||
Abbey | 48.0 | 4 | 14.7 | 1 | 9.7 | 0 | 11.5 | 1 | 16.1 | 0 | 6 |
Ballyholme and Groomsport | 37.8 | 3 | 13.7 | 1 | 12.8 | 1 | 4.7 | 0 | 31.0 | 2 | 7 |
Bangor West | 28.9 | 2 | 17.9 | 2 | 14.0 | 2 | 4.3 | 0 | 34.9 | 1 | 7 |
Holywood | 30.6 | 2 | 31.9 | 2 | 21.2 | 1 | 12.0 | 0 | 4.3 | 0 | 5 |
Total | 36.2 | 8 | 18.3 | 6 | 13.9 | 4 | 7.4 | 1 | 24.2 | 3 | 25 |
2005: 3 x DUP, 2 x UUP, 1 x Alliance
2011: 4 x DUP, 1 x Alliance, 1 x Green
2005-2011 Change: DUP and Green gain from UUP (two seats)
Party | Candidate | FPv% | Count | |||||||||||||
---|---|---|---|---|---|---|---|---|---|---|---|---|---|---|---|---|
1 | 2 | 3 | 4 | 5 | 6 | 7 | 8 | 9 | 10 | 11 | 12 | 13 | ||||
DUP | Ivy Cooling* | 16.01% | 859 | |||||||||||||
Alliance | Michael Bower | 14.74% | 791 | |||||||||||||
DUP | Wesley Irvine* | 12.99% | 697 | 702.3 | 703.14 | 703.2 | 706.23 | 709.23 | 712.23 | 717.23 | 732.29 | 742.45 | 759.68 | 828.68 | ||
Green (NI) | Steven Agnew | 11.51% | 618 | 619 | 629.56 | 633.62 | 641.68 | 651.95 | 656.95 | 663.17 | 682.38 | 698.57 | 711.88 | 776.88 | ||
DUP | Harry Dunlop* | 9.99% | 536 | 606.3 | 607.92 | 607.92 | 609.92 | 614.01 | 618.01 | 620.11 | 630.24 | 647.3 | 662.53 | 731.75 | 753.75 | |
DUP | William Montgomery* | 9.04% | 485 | 489.2 | 489.92 | 492.92 | 492.92 | 497.95 | 503.95 | 508.95 | 521.95 | 534.01 | 546.11 | 592.43 | 610.43 | |
UUP | Heather Bingham-Steele | 5.65% | 303 | 303.9 | 305.07 | 305.1 | 307.2 | 312.23 | 313.23 | 318.26 | 332.44 | 348.6 | 518.53 | 549.89 | 554.89 | |
Community Partnership | Mark Gordon | 6.80% | 365 | 365.8 | 366.7 | 368.7 | 372.73 | 376.76 | 379.76 | 423.03 | 432.12 | 444.21 | 455.33 | |||
UUP | Aaron Jamison | 4.06% | 218 | 219.1 | 220.09 | 220.09 | 223.09 | 225.12 | 228.12 | 230.15 | 255.24 | 275.3 | ||||
UKIP | William Ferguson | 1.90% | 102 | 102.2 | 102.83 | 102.83 | 104.89 | 107.92 | 148.95 | 150.05 | 164.11 | |||||
NI Conservatives | Dean Russell | 2.35% | 126 | 126.1 | 126.97 | 127 | 127.1 | 129.16 | 133.16 | 136.16 | ||||||
Community Partnership | Karen Worrall | 1.42% | 76 | 76.3 | 76.78 | 77.78 | 78.78 | 84.78 | 86.81 | |||||||
UKIP | Stuart Tanner | 1.36% | 73 | 73 | 73.06 | 73.06 | 74.06 | 77.09 | ||||||||
Independent | Ed Simpson | 1.36% | 44 | 44 | 44.72 | 61.05 | 70.11 | |||||||||
Independent | Christopher Carter | 0.73% | 39 | 39.3 | 39.72 | 42.72 | ||||||||||
Independent | Robert Mooney | 0.65% | 35 | 35 | 35.57 | |||||||||||
Electorate: 13,358 Valid: 5,367 (40.18%) Spoilt: 128 Quota: 767 Turnout: 5,495 (41.14%) |
2005: 2 x DUP, 2 x UUP, 2 x Independent, 1 x Alliance
2011: 3 x DUP, 2 x Independent, 1 x Alliance, 1 x UUP
2005-2011 Change: DUP gain from UUP
Party | Candidate | FPv% | Count | |||||||||||
---|---|---|---|---|---|---|---|---|---|---|---|---|---|---|
1 | 2 | 3 | 4 | 5 | 6 | 7 | 8 | 9 | 10 | 11 | ||||
DUP | Alex Easton * | 22.06% | 1,812 | |||||||||||
Independent | Alan Chambers * | 18.03% | 1,481 | |||||||||||
DUP | Peter Weir * | 9.28% | 762 | 1,048.88 | ||||||||||
DUP | Peter Martin | 6.44% | 529 | 903.88 | 980.72 | 997.16 | 1,019.52 | 1,053.52 | ||||||
UUP | Ian Henry* | 5.04% | 414 | 434.68 | 479.56 | 484.32 | 547.32 | 586.58 | 659.86 | 684 | 687 | 1,100 | ||
Alliance | Christine Bower | 7.38% | 606 | 615.68 | 648.32 | 654.32 | 662.88 | 690.7 | 731.16 | 854.1 | 856.1 | 897.26 | 911.26 | |
Independent | Austen Lennon* | 6.12% | 503 | 532.48 | 615.44 | 619.44 | 627.78 | 660.02 | 740.06 | 812.14 | 816.14 | 844.18 | 854.18 | |
Alliance | Adam Harbinson | 6.37% | 523 | 533.12 | 570.52 | 575.52 | 586.98 | 617.8 | 651.34 | 764.28 | 767.28 | 794.66 | 801.66 | |
UUP | Colin Breen | 5.64% | 463 | 478.84 | 514.2 | 524.88 | 572.26 | 597.82 | 624.78 | 654.14 | 657.14 | |||
Green (NI) | Paul Roberts | 4.75% | 390 | 392.2 | 408.86 | 418.56 | 422.44 | 449.78 | 472.82 | |||||
Independent | Roberta Dunlop* | 2.71% | 223 | 233.56 | 307.34 | 319.22 | 324.9 | 351.06 | ||||||
NI Conservatives | David Symington | 2.86% | 235 | 241.16 | 258.16 | 272.6 | 284.94 | |||||||
UUP | Francis McCully | 2.11% | 173 | 180.04 | 198.4 | 205.08 | ||||||||
UKIP | Pat Toms | 1.23% | 101 | 107.6 | 113.38 | |||||||||
Electorate: 17,062 Valid: 8,215 (48.15%) Spoilt: 107 Quota: 1,027 Turnout: 8,322 (48.78%) |
2005: 2 x DUP, 2 x UUP, 2 x Alliance, 1 x Green
2011: 2 x DUP, 2 x UUP, 2 x Alliance, 1 x Independent
2005-2011 Change: Green becomes Independent
Party | Candidate | FPv% | Count | |||||||||||
---|---|---|---|---|---|---|---|---|---|---|---|---|---|---|
1 | 2 | 3 | 4 | 5 | 6 | 7 | 8 | 9 | 10 | 11 | ||||
Independent | Brian Wilson * | 20.86% | 1,458 | |||||||||||
DUP | Alan Graham* | 15.55% | 1,087 | |||||||||||
DUP | Alan Leslie* | 13.32% | 931 | |||||||||||
Alliance | Anne Wilson* | 11.56% | 808 | 1,107.28 | ||||||||||
UUP | Marion Smith* | 9.84% | 688 | 772.28 | 837.8 | 908.36 | ||||||||
Alliance | Tony Hill* | 6.31% | 441 | 493.89 | 590.22 | 602.54 | 606.14 | 607.66 | 608.66 | 622.82 | 658.67 | 824.12 | 863.6 | |
UUP | James McKerrow* | 4.12% | 288 | 312.08 | 321.05 | 402.53 | 428.93 | 453.63 | 457.93 | 509.31 | 586.4 | 593.12 | 645.89 | |
Green (NI) | Joanne Dunlop | 4.31% | 301 | 351.74 | 384.5 | 394.02 | 398.22 | 400.5 | 403.6 | 424.48 | 449.1 | 541.19 | 575.81 | |
Community Partnership | Alison Blayney | 2.75% | 192 | 199.31 | 202.82 | 206.46 | 210.66 | 211.04 | 329.41 | 349.47 | 356.96 | 366.21 | ||
SDLP | Liam Logan | 4.26% | 298 | 325.09 | 337.18 | 339.98 | 341.28 | 341.66 | 342.76 | 347.61 | 355.9 | |||
NI Conservatives | Julian Robertson | 2.59% | 181 | 196.91 | 201.59 | 210.27 | 213.27 | 215.74 | 216.74 | 239.31 | ||||
UKIP | Ade Benson | 2.16% | 151 | 164.76 | 167.1 | 184.74 | 190.24 | 191.19 | 195.29 | |||||
Community Partnership | Jamie Bryson | 2.39% | 167 | 168.72 | 170.28 | 171.96 | 176.36 | 176.74 | ||||||
Electorate: 14,952 Valid: 6,991 (46.76%) Spoilt: 160 Quota: 874 Turnout: 7,151 (47.83%) |
2005: 2 x UUP, 2 x Alliance, 1 x DUP
2011: 2 x Alliance, 2 x DUP, 1 x UUP
2005-2011 Change: DUP gain from UUP
Party | Candidate | FPv% | Count | ||||||
---|---|---|---|---|---|---|---|---|---|
1 | 2 | 3 | 4 | 5 | 6 | ||||
DUP | Gordon Dunne * | 24.79% | 1,081 | ||||||
Alliance | Andrew Muir | 22.73% | 991 | ||||||
UUP | Ellie McKay* | 15.48% | 675 | 739.94 | |||||
Alliance | Laurence Thompson | 9.20% | 401 | 414.26 | 645.65 | 810.65 | |||
DUP | Jennifer Gilmour | 5.78% | 252 | 449.52 | 503.03 | 627.22 | 658.54 | 668.66 | |
Green (NI) | John Barry | 12.04% | 525 | 533.5 | 550.78 | 611.2 | 663.4 | 665.6 | |
UUP | Gillian McGimpsey | 5.73% | 250 | 262.92 | 268.05 | ||||
NI Conservatives | David O'Callaghan | 4.24% | 185 | 189.76 | 192.73 | ||||
Electorate: 9,433 Valid: 4,360 (46.22%) Spoilt: 76 Quota: 727 Turnout: 4,436 (47.03%) |
Castle is one of the ten district electoral areas in Belfast, Northern Ireland. Located in the north of the city, the district elects six members to Belfast City Council and contains the wards of Bellevue, Cavehill, Chichester Park, Duncairn, Fortwilliam and Innisfayle. Castle, along with Oldpark district and parts of the Court district and Newtownabbey Borough Council, forms the Belfast North constituency for the Northern Ireland Assembly and UK Parliament. The district is bounded to the east by the Victoria Channel, to the north by Newtownabbey Borough Council and Belfast Lough, to the south by North Street and to the west by the Cavehill Road.
Elections to Belfast City Council were held on 5 May 2011 on the same day as the other Northern Irish local government elections. The election used nine district electoral areas to elect a total of 51 councillors, most representing the more heavily populated north and west.
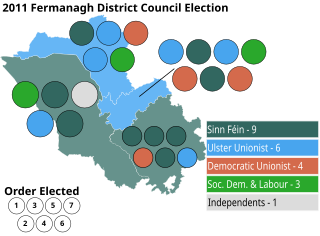
Elections to Fermanagh District Council were held on 5 May 2011 on the same day as the other Northern Irish local government elections. The election used four district electoral areas to elect a total of 23 councillors.
Elections to North Down Borough Council were held on 5 May 2005 on the same day as the other Northern Irish local government elections. The election used four district electoral areas to elect a total of 25 councillors.
Elections to Ards Borough Council were held on 5 May 2011 on the same day as the other Northern Irish local government elections. The election used four district electoral areas to elect a total of 23 councillors.
Elections to Castlereagh Borough Council were held on 5 May 2011 on the same day as the other Northern Irish local government elections. The election used four district electoral areas to elect a total of 23 councillors.
Elections to Lisburn City Council were held on 5 May 2011 on the same day as the other Northern Irish local government elections. The election used five district electoral areas to elect a total of 30 councillors.
Elections to Newtownabbey Borough Council were held on 5 May 2011 on the same day as the other Northern Irish local government elections. The election used four district electoral areas to elect a total of 25 councillors.
Elections to Antrim Borough Council were held on 5 May 2011 on the same day as the other Northern Irish local government elections. The election used three district electoral areas to elect a total of 19 councillors.
Elections to Carrickfergus Borough Council were held on 5 May 2011 on the same day as the other Northern Irish local government elections. The election used three district electoral areas to elect a total of 17 councillors.
Elections to Larne Borough Council were held on 5 May 2011 on the same day as the other Northern Irish local government elections. The election used three district electoral areas to elect a total of 15 councillors.
Elections to Ballymena Borough Council were held on 5 May 2011 on the same day as the other Northern Irish local government elections. The election used four district electoral areas to elect a total of 24 councillors.
Elections to Coleraine Borough Council were held on 5 May 2011 on the same day as the other Northern Irish local government elections. The election used four district electoral areas to elect a total of 22 councillors.
Elections to Craigavon Borough Council were held on 5 May 2011 on the same day as the other Northern Irish local government elections. The election used four district electoral areas to elect a total of 26 councillors.
Elections to Banbridge District Council were held on 5 May 2011 on the same day as the other Northern Irish local government elections. The election used three district electoral areas to elect a total of 17 councillors.
Elections to Down District Council were held on 5 May 2011 on the same day as the other Northern Irish local government elections. The election used four district electoral areas to elect a total of 23 councillors.
Elections to Newry and Mourne District Council were held on 5 May 2011 on the same day as the other Northern Irish local government elections. The election used five district electoral areas to elect a total of 30 councillors.
Bangor West is one of the seven district electoral areas (DEA) in Ards and North Down, Northern Ireland. The district elects five members to Ards and North Down Borough Council and contains the wards of Bryansburn, Kilcooley, Rathgael, Rathmore and Silverstream. Bangor West forms part of the North Down constituencies for the Northern Ireland Assembly and UK Parliament.
Newtownards is one of the seven district electoral areas (DEA) in Ards and North Down, Northern Ireland. The district elects five members to Ards and North Down Borough Council and contains the wards of Conway Square, Cronstown, Glen, Gregstown, Movilla, Scrabo and West Winds. Newtownards forms part of the Strangford constituencies for the Northern Ireland Assembly and UK Parliament.
Holywood was one of the four district electoral areas in North Down, Northern Ireland which existed from 1985 to 2014. The district elected five members to North Down Borough Council and formed part of the North Down constituencies for the Northern Ireland Assembly and UK Parliament.