| ||||||||||||||||
All 51 seats to Erewash Borough Council 26 seats needed for a majority | ||||||||||||||||
---|---|---|---|---|---|---|---|---|---|---|---|---|---|---|---|---|
|
The 2011 Erewash Borough Council election took place on 5 May 2011 to elect members of Erewash Borough Council in Derbyshire, England. The whole council was up for election. [1]
Party | Seats | Gains | Losses | Net gain/loss | Seats % | Votes % | Votes | +/− | |
---|---|---|---|---|---|---|---|---|---|
Conservative | 26 | ||||||||
Labour | 25 | ||||||||
Liberal Democrats | 0 | ||||||||
Other parties | 0 | ||||||||
Party | Candidate | Votes | % | ±% | |
---|---|---|---|---|---|
Conservative | Val Custance (E) | 710 | 26.2 | ||
Labour | James Clifford Hedley Dawson (E) | 654 | 24.2 | ||
Labour | Anthony Martin Seeds | 597 | 22.1 | ||
Conservative | Kathryn Mary Major | 583 | 21.5 | ||
Liberal Democrats | Angela Togni | 164 | 6.1 | ||
Turnout | 39.5 | ||||
Conservative hold | Swing | ||||
Labour gain from Conservative | Swing | ||||
Party | Candidate | Votes | % | ±% | |
---|---|---|---|---|---|
Conservative | Margaret Annie Orchard (E) | 1277 | 34.6 | ||
Conservative | Robert Alan Parkinson (E) | 1207 | 32.7 | ||
Labour | Charlie Sarell | 633 | 17.2 | ||
Labour | Pam Neill | 570 | 15.5 | ||
Turnout | 54.0 | ||||
Conservative hold | Swing | ||||
Party | Candidate | Votes | % | ±% | |
---|---|---|---|---|---|
Labour | John Booth (E) | 662 | 33.2 | ||
Labour | David George Morgan (E) | 605 | 30.3 | ||
Conservative | John Francis Hay-Heddle | 278 | 13.9 | ||
Conservative | Simon James Ratcliffe | 267 | 13.4 | ||
BNP | Mark Bailey | 185 | 9.3 | ||
Turnout | 34.8 | ||||
Labour hold | Swing | ||||
Party | Candidate | Votes | % | ±% | |
---|---|---|---|---|---|
Labour | Howard Griffiths (E) | 786 | 29.8 | ||
Labour | Margaret Griffths (E) | 781 | 29.6 | ||
Conservative | Richard Harris | 556 | 21.1 | ||
Conservative | Amanda Solloway | 518 | 19.6 | ||
Turnout | 40.2 | ||||
Labour hold | Swing | ||||
Party | Candidate | Votes | % | ±% | |
---|---|---|---|---|---|
Labour | Keri Andrews (E) | 902 | 15.3 | ||
Conservative | Garry Keith Hickton (E) | 886 | 15.0 | ||
Conservative | Kevin Philip Miller (E) | 876 | 14.9 | ||
Conservative | Nicola Jane Southern | 854 | 14.5 | ||
Labour | Helen Scott | 826 | 14.0 | ||
Labour | David Vincent Dominic Alamu | 822 | 13.9 | ||
Liberal Democrats | Ian Allan Neill | 275 | 4.7 | ||
Liberal Democrats | Jane Elizabeth Oseman | 272 | 4.6 | ||
BNP | Colin Stephen Smedley | 188 | 3.2 | ||
Turnout | 47.8 | ||||
Labour hold | Swing | ||||
Conservative hold | Swing | ||||
Party | Candidate | Votes | % | ±% | |
---|---|---|---|---|---|
Conservative | Val Clare (E) | 863 | 30.2 | ||
Conservative | Derek Ivor Orchard (E) | 852 | 29.8 | ||
Labour | Katie Louise Russell | 391 | 13.7 | ||
Labour | Martin Waring | 375 | 13.1 | ||
Liberal Democrats | Martin Charles Garnett | 223 | 7.8 | ||
Liberal Democrats | Michael Kevin Madin | 155 | 5.4 | ||
Turnout | 47.1 | ||||
Conservative hold | Swing | ||||
Party | Candidate | Votes | % | ±% | |
---|---|---|---|---|---|
Labour | Edward Albert Bishop (E) | 773 | 29.4 | ||
Labour | Alexander Phillips (E) | 677 | 25.7 | ||
Conservative | Bridget Mary Adams-Shaw | 470 | 17.9 | ||
Conservative | Darren Kendrick Adams-Shaw | 418 | 15.9 | ||
English Democrat | Giles Farrand | 292 | 11.1 | ||
Turnout | 40.6 | ||||
Labour hold | Swing | ||||
Party | Candidate | Votes | % | ±% | |
---|---|---|---|---|---|
Labour | Glennice Birkin (E) | 901 | 41.0 | ||
Labour | Frank Charles Phillips (E) | 838 | 38.1 | ||
Conservative | Robert Rose | 286 | 13.0 | ||
Conservative | Roger Mervyn Charles Williams | 173 | 7.9 | ||
Turnout | 37.2 | ||||
Labour hold | Swing | ||||
Party | Candidate | Votes | % | ±% | |
---|---|---|---|---|---|
Labour | Ernest Bevan (E) | 609 | 33.5 | ||
Labour | Jane Wilson (E) | 533 | 29.3 | ||
Conservative | Jennifer Margaret Bartlett | 293 | 16.1 | ||
Conservative | Gerri Hickton | 250 | 13.7 | ||
BNP | Christopher Roy Adcock | 135 | 7.4 | ||
Turnout | 34.8 | ||||
Labour hold | Swing | ||||
Party | Candidate | Votes | % | ±% | |
---|---|---|---|---|---|
Labour | John Arnold Frudd (E) | 1111 | 25.5 | ||
Labour | Louis Booth (E) | 1101 | 25.2 | ||
Labour | Stephen Derek Green (E) | 1056 | 24.2 | ||
Conservative | Alan Thomas Beadling | 392 | 9.0 | ||
Conservative | Margaret Lilian McCaig | 365 | 8.4 | ||
Conservative | Michael William Tudbury | 340 | 7.8 | ||
Turnout | 36.7 | ||||
Labour hold | Swing | ||||
Party | Candidate | Votes | % | ±% | |
---|---|---|---|---|---|
Conservative | Alan Summerfield (E) | 728 | 28.9 | ||
Conservative | Abey Stevenson (E) | 661 | 26.3 | ||
Independent | Simon Downing | 584 | 23.2 | ||
Labour | June Elwell | 340 | 13.5 | ||
Labour | George Carr-Williamson | 209 | 8.3 | ||
Turnout | 50.9 | ||||
Conservative hold | Swing | ||||
Party | Candidate | Votes | % | ±% | |
---|---|---|---|---|---|
Conservative | Mary Hopkinson (E) | 745 | 27.7 | ||
Conservative | David Stephenson (E) | 647 | 24.1 | ||
Labour | Simon Haydon | 588 | 21.9 | ||
Labour | Phillipa Jemma Tatham | 536 | 19.9 | ||
Green | Philip Hood | 174 | 6.5 | ||
Turnout | 45.9 | ||||
Conservative hold | Swing | ||||
Party | Candidate | Votes | % | ±% | |
---|---|---|---|---|---|
Labour | Ann Stevenson (E) | 825 | 15.7 | ||
Labour | Clare Elaine Neill (E) | 817 | 15.5 | ||
Conservative | Donna Anne Briggs (E) | 802 | 15.2 | ||
Labour | Peter Ball | 790 | 15.0 | ||
Conservative | Alan Griffiths | 756 | 14.4 | ||
Conservative | Michael Charlesworth Powell | 729 | 13.8 | ||
Liberal Democrats | Lucinda Clare Allen | 204 | 3.9 | ||
Liberal Democrats | Jacqueline Ward | 191 | 3.6 | ||
Liberal Democrats | Kristopher James Watts | 153 | 2.9 | ||
Turnout | 42.0 | ||||
Labour gain from Conservative | Swing | ||||
Conservative hold | Swing | ||||
Party | Candidate | Votes | % | ±% | |
---|---|---|---|---|---|
Labour | Roland Hosker (E) | 1037 | 20.9 | ||
Labour | Denise Mellors (E) | 936 | 18.9 | ||
Labour | Cheryl Pidgeon (E) | 907 | 18.3 | ||
Conservative | Mary Gough | 738 | 14.9 | ||
Conservative | Allison Elizabeth Maguire | 674 | 13.6 | ||
Conservative | Pamela Popp | 664 | 13.4 | ||
Turnout | 40.4 | ||||
Labour hold | Swing | ||||
Labour gain from Conservative | Swing | ||||
Party | Candidate | Votes | % | ±% | |
---|---|---|---|---|---|
Conservative | Terry Holbrook (E) | 1707 | 21.1 | ||
Conservative | Vera Tumanow (E) | 1700 | 21.0 | ||
Conservative | Mike Wallis (E) | 1675 | 20.7 | ||
Labour | Jeff Martin | 1033 | 12.7 | ||
Labour | David Harrison | 1006 | 12.4 | ||
Labour | Philip Edward Whitt | 988 | 12.2 | ||
Turnout | 51.3 | ||||
Conservative hold | Swing | ||||
Party | Candidate | Votes | % | ±% | |
---|---|---|---|---|---|
Labour | Pamela Phillips (E) | 705 | 36.0 | ||
Labour | Patrick Thomas Moloney (E) | 680 | 34.8 | ||
Conservative | Lynne Blackburn | 301 | 15.4 | ||
Conservative | Victor William Gillgan | 271 | 13.9 | ||
Turnout | 36.5 | ||||
Labour hold | Swing | ||||
Party | Candidate | Votes | % | ±% | |
---|---|---|---|---|---|
Conservative | Steve Bilbie (E) | 650 | 23.9 | ||
Labour | Michelle Wendy Booth (E) | 627 | 23.1 | ||
Labour | Linda Marie Frudd | 579 | 21.3 | ||
Conservative | Alan Geoffrey Hardy | 574 | 21.1 | ||
Independent | Angie Nisbet | 285 | 10.5 | ||
Turnout | 40.5 | ||||
Conservative hold | Swing | ||||
Labour gain from Independent | Swing | ||||
Party | Candidate | Votes | % | ±% | |
---|---|---|---|---|---|
Conservative | Gary Dinsdale (E) | 770 | 27.4 | ||
Conservative | Jennifer Hulls (E) | 702 | 24.9 | ||
Labour | Les White | 461 | 16.4 | ||
Labour | Peter Thorne | 400 | 14.2 | ||
Independent | Rosalind Joan Heydon | 225 | 8.0 | ||
Liberal Democrats | Martin Lowe | 141 | 5.0 | ||
Liberal Democrats | Cally Joanne Bamford | 116 | 4.1 | ||
Turnout | 46.0 | ||||
Conservative hold | Swing | ||||
Party | Candidate | Votes | % | ±% | |
---|---|---|---|---|---|
Conservative | Daniel Walton (E) | 857 | 14.4 | ||
Conservative | Jo Bonam (E) | 816 | 13.7 | ||
Labour | Russ Woolford (E) | 789 | 13.2 | ||
Labour | Adam Hosker | 780 | 13.1 | ||
Conservative | Mary Smith | 756 | 12.7 | ||
Labour | Owen Kenneth Llewellyn | 710 | 11.9 | ||
Liberal Democrats | Geoffrey William Daxer | 434 | 7.3 | ||
Liberal Democrats | Rodney Wilby Allen | 423 | 7.1 | ||
Liberal Democrats | Rachel Allen | 408 | 6.8 | ||
Turnout | 43.5 | ||||
Conservative gain from Independent | Swing | ||||
Conservative gain from Liberal Democrats | Swing | ||||
Labour gain from Liberal Democrats | Swing | ||||
Party | Candidate | Votes | % | ±% | |
---|---|---|---|---|---|
Labour | Linda McGraw (E) | 426 | 53.6 | ||
Conservative | Anne Marie Stevenson | 369 | 46.4 | ||
Turnout | 46.9 | ||||
Labour hold | Swing | ||||
Party | Candidate | Votes | % | ±% | |
---|---|---|---|---|---|
Conservative | Carol Ann Hart (E) | 1164 | 22.7 | ||
Conservative | Bruce Philip Broughton (E) | 969 | 18.9 | ||
Conservative | Barbara Constance Harrison (E) | 881 | 17.2 | ||
Independent | Gary Hamson | 602 | 11.8 | ||
Independent | Peter Henry Steiner | 449 | 8.8 | ||
Labour | Sally Ann Haydon | 386 | 7.5 | ||
Labour | Sharon Langham | 341 | 6.7 | ||
Labour | John Pounder | 330 | 6.4 | ||
Turnout | 49.0 | ||||
Conservative hold | Swing | ||||
Party | Candidate | Votes | % | ±% | |
---|---|---|---|---|---|
Conservative | Chris Corbett (E) | 1159 | 19.2 | ||
Conservative | Geoffrey Brassey Smith (E) | 981 | 12.3 | ||
Conservative | Kewal Singh Athwal (E) | 899 | 14.9 | ||
Labour | David Scott | 886 | 14.7 | ||
Labour | Philip Pidgeon | 873 | 14.5 | ||
Labour | Bill Stevenson | 836 | 13.9 | ||
Liberal Democrats | Fiona Aanonson | 399 | 6.6 | ||
Turnout | 43.0 | ||||
Conservative hold | Swing | ||||
South Derbyshire is a local government district in Derbyshire, England. The district covers the towns of Melbourne and Swadlincote as well as numerous villages and hamlets such as Hilton, Hatton, Etwall, Aston-on-Trent, Repton, Weston-on-Trent and Willington. About a third of the National Forest lies within the district.
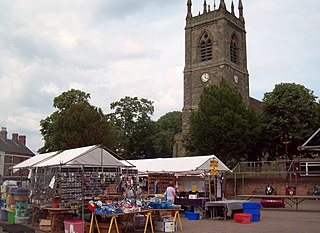
Erewash is a local government district with borough status in Derbyshire, England. The borough is named after the River Erewash. The council has offices in both the borough's towns of Ilkeston and Long Eaton. The borough also includes several villages and surrounding rural areas. Some of the built-up areas in the east of the borough form part of the Nottingham Urban Area.
Amber Valley is a constituency in Derbyshire, represented in the House of Commons of the UK Parliament since 2010 by Nigel Mills, a Conservative.
Erewash is a constituency in Derbyshire represented in the House of Commons of the UK Parliament since 2015 by Maggie Throup, a Conservative.
Mid Derbyshire is a constituency represented in the House of Commons of the UK Parliament since its 2010 creation by Pauline Latham, a Conservative.
Derbyshire County Council is the upper-tier local authority for the non-metropolitan county of Derbyshire in England. The council is based at County Hall in Matlock. Since 2017 the council has been under Conservative majority control.
Erewash Borough Council elections are held every four years. Erewash Borough Council is the local authority for the non-metropolitan district of Erewash in Derbyshire, England. Since the last boundary changes in 2015, 47 councillors are elected from 19 wards.
The 2015 Erewash Borough Council election took place on 7 May 2015 to elect members of Erewash Borough Council in England. This was on the same day as other local elections.
The 2007 Erewash Borough Council election took place on 3 May 2007 to elect members of Erewash Borough Council in Derbyshire, England. The whole council was up for election.
The 2003 Erewash Borough Council election took place on 1 May 2003 to elect members of Erewash Borough Council in Derbyshire, England. The whole council was up for election.
Elections to Erewash Borough Council were held on 6 May 1999 as part of nationwide local elections.
Elections to Erewash Borough Council were held on 4 May 1995 as part of nationwide local elections. The election saw the Labour Party retain control of the council.
Elections to Erewash Borough Council were held on 2 May 1991 as part of nationwide local elections. The election saw the Labour Party gain control of the Council for the first time since 1976.
Elections to Erewash Borough Council were held on 7 May 1987 as part of nationwide local elections.
Elections to Erewash Borough Council were held on 5 May 1983 as part of nationwide local elections.
Elections to Erewash Borough Council were held on 3 May 1979 as part of nationwide local elections.
Elections to Erewash Borough Council were held on 6 May 1976 as part of nationwide local elections. The election saw the Conservative Party gain control of the Council for the first time.
Elections to Erewash District Council were held on 10 May 1973 as part of nationwide local elections. The new district was formed by the merger of the Borough of Ilkeston, the Long Eaton urban district and the parishes of Breadsall, Breaston, Dale Abbey, Draycott and Church Wilne, Hopwell, Little Eaton, Morley, Ockbrook, Risley, Sandiacre, Stanley, Stanton by Dale and West Hallam from the South East Derbyshire Rural District. The new council became a shadow authority before taking over from the existing local authorities on 1 April 1974. The election saw the Labour Party gain control of the Council. Erewash District Council was granted Borough Status in 1975 and from thereon became known as Erewash Borough Council.
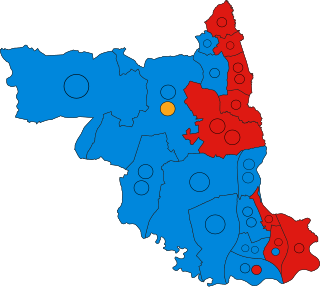
The 2019 Erewash Borough Council election was held on 2 May 2019 to elect members of Erewash Borough Council in Derbyshire, England. The whole council was up for election.
The 2023 Erewash Council election took place on 4 May 2023 to elect all 47 members of Erewash Borough Council in Derbyshire, England. This was on the same day as other local elections across England.