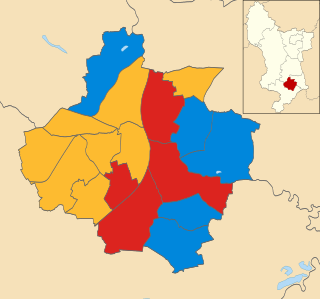
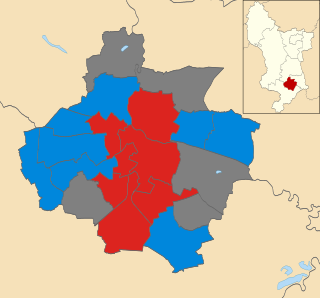
Derby City Council elections are held every four years to elect members of Derby City Council, the local authority for the unitary authority of Derby in Derbyshire, England. Since the last boundary changes in 2023, 51 councillors have been elected from 18 wards. Prior to 2023 elections were held three years out of every four, with a third of the council elected each time.

Local elections were held in the United Kingdom on 6 May 1976. Elections were for one third of the seats on Metropolitan borough councils and for all seats on Non-Metropolitan district councils in England; and for all seats on the Welsh district councils.

The 1999 Derby City Council election took place on 6 May 1999 to elect members of Derby City Council in England. One third of the council was up for election and the Labour party kept overall control of the council. Overall turnout was 29.0%.

The 2004 Derby City Council election took place on 10 June 2004 to elect members of Derby City Council in England. One third of the council was up for election and the council stayed under no overall control.

The 2006 Derby City Council election took place on 4 May 2006 to elect members of Derby City Council in England. One third of the council was up for election and the Labour Party lost their majority on the council to no overall control.

The 2007 Derby City Council election took place on 3 May 2007 to elect members of Derby City Council in England. One third of the council was up for election and the council stayed under no overall control.

The 2008 Derby City Council election took place on 1 May 2008 to elect members of Derby City Council in England. One third of the council was up for election and the council stayed under no overall control. Overall turnout was 34.6%.

The 1991 United Kingdom local elections were held on Thursday 2 May 1991. The results were a setback for the governing Conservative Party, who were left with their lowest number of councillors since 1973, though their popular vote was an improvement from the 1990 local elections.

Local elections were held in the United Kingdom on 3 May 1979. The results provided some source of comfort to the Labour Party, who recovered some lost ground from local election reversals in previous years, despite losing the general election to the Conservative Party on the same day. The Liberals also gained councillors and a council.
The 1974 Hammersmith Council election took place on 2 May 1974 to elect members of Hammersmith London Borough Council in London, England. The whole council was up for election and the Labour Party stayed in overall control of the council.
The 1995 Cardiff Council election was the first election to the new unitary County Council of the City and County of Cardiff following the re-organization of local government in Wales. It was held on Thursday 4 May 1995. It was followed by the 1999 elections. On the same day there were elections to the other 21 local authorities in Wales and community councils in Wales. Labour won a majority of the seats. It was preceded in Cardiff by the 1991 elections to Cardiff City Council and the 1993 elections to South Glamorgan County Council.

The 1982 Derby City Council election took place on 6 May 1982 to elect members of Derby City Council in England. This was on the same day as other local elections. 15 of the council's 44 seats were up for election. The Labour Party retained control of the council.

The 1983 Derby City Council election took place on 5 May 1983 to elect members of Derby City Council in England. This was on the same day as other local elections. 15 of the council's 44 seats were up for election. The Labour Party retained control of the council.

The 1984 Derby City Council election took place on 3 May 1984 to elect members of Derby City Council in England. This was on the same day as other local elections. 15 of the council's 44 seats were up for election. The Labour Party retained control of the council.

The 1986 Derby City Council election took place on 8 May 1986 to elect members of Derby City Council in England. Local elections were held in the United Kingdom in 1986. This was on the same day as other local elections. 15 of the council's 44 seats were up for election. The Labour Party retained control of the council.

The 1987 Derby City Council election took place on 7 May 1987 to elect members of Derby City Council in England. Local elections were held in the United Kingdom in 1987. This was on the same day as other local elections. 15 of the council's 44 seats were up for election. The Labour Party retained control of the council.

The 1988 Derby City Council election took place on 5 May 1988 to elect members of Derby City Council in England. Local elections were held in the United Kingdom in 1988. This was on the same day as other local elections. 15 of the council's 44 seats were up for election. The Conservatives gained control of the council from the Labour Party.

The 1990 Derby City Council election took place on 3 May 1990 to elect members of Derby City Council in England. Local elections were held in the United Kingdom in 1990. This was on the same day as other local elections. 16 of the council's 44 seats were up for election. The Conservative Party retained control of the council.

The 1992 Derby City Council election took place on 7 May 1992 to elect members of Derby City Council in England. Local elections were held in the United Kingdom in 1992. This was on the same day as other local elections. 14 of the council's 44 seats were up for election. No seats changed hands and the council remained under no overall control, with the Conservatives and Labour holding exactly half the seats each.

The 2021 Derby City Council election took place on 6 May 2021 to elect members of Derby City Council in England. This was on the same day as other local elections. One-third of the seats were up for election, with one ward (Darley) electing two councillors.


