1991 Horsham District Council election

Last updated

The 1991 Horsham District Council election took place on 2 May 1991 to elect members of Horsham District Council in England. [1] It was held on the same day as other local elections. The Conservatives retained control of the council with a reduced majority. The Liberal Democrats gained a net total of 7 and Independent candidates had 2 councillors elected.

Contents

1991 Horsham District Council election
Flag of England.svg
  1987 2 May 1991 1995  

All 43 seats to Horsham District Council
22 seats needed for a majority
 First partySecond partyThird party
 
Party Conservative Liberal Democrats Independent
Seats won28132
Seat changeDecrease2.svg 5Increase2.svg 7Decrease2.svg 2

Council composition

Prior to the election, the composition of the council was:

3364
ConSDP-LibInd

After the election, the composition of the council was:

28132
ConLib DemInd

Results summary

1991 Horsham District Council election
PartySeatsGainsLossesNet gain/lossSeats %Votes %Votes+/−
  Conservative 2838Decrease2.svg 565.141.514,922-12.2
  Liberal Democrats 1381Increase2.svg 730.237.013,292+6.9
  Independent 202Decrease2.svg 24.74.61,638-0.9
  Labour 0Steady2.svg0.015.85,692+8.0
  Green 0Steady2.svg0.00.8289-0.5
  Ind. Conservative 0Steady2.svg0.00.292+0.2

Ward results

Billingshurst

Billingshurst
PartyCandidateVotes%±%
Conservative Van Den Bergh S. Ms.*Unopposed
Conservative Jones B.Unopposed
Turnout N/A
Conservative gain from Liberal Democrats Swing
Conservative hold Swing

Bramber & Upper Beeding

Bramber & Upper Beeding
PartyCandidateVotes%±%
Liberal Democrats Campbell J. Ms. 880 37.9 -0.9
Independent Sanford L. 833 35.9 -1.1
Conservative Williamson V. Ms.60826.2+2.1
Turnout 67.2
Liberal Democrats hold Swing
Independent hold Swing

Broadbridge Heath

Broadbridge Heath
PartyCandidateVotes%±%
Liberal Democrats Horner S. Ms. 652 61.9 +15.8
Conservative Gillman L. Ms.31730.1-17.0
Labour Duffy P.848.0+1.1
Turnout 45.8
Liberal Democrats gain from Conservative Swing

Chanctonbury

Chanctonbury
PartyCandidateVotes%±%
Conservative Jenkins E. 928 53.1 -9.4
Conservative Smith P. 876
Liberal Democrats Greensmith A. Ms.82146.9+9.4
Liberal Democrats House G. Ms.789
Turnout 46.5
Conservative hold Swing

Cowfold

Cowfold
PartyCandidateVotes%±%
Conservative Capo-Bianco S. Ms.Unopposed
Turnout N/A
Conservative hold Swing

Denne

Denne
PartyCandidateVotes%±%
Conservative Billington P. 1,351 51.0 -4.5
Conservative Palmer B. Ms. 1,340
Conservative Hogben E. Ms. 1,287
Liberal Democrats Eeles N. Ms.73027.5-3.3
Liberal Democrats Beeson M. Ms.714
Labour Thurston J. Ms.57021.5+7.8
Turnout 48.9
Conservative hold Swing

Forest

Forest
PartyCandidateVotes%±%
Liberal Democrats Rutherford P. Ms. 1,196 45.1 +10.3
Liberal Democrats Newman D. 1,137
Conservative Mauchel E. Ms. 1,109 41.8 -9.3
Conservative Sanson J.1,038
Conservative Wilkinson F.958
Labour Dumbrill D. Ms.34713.1-1.0
Labour Uwins B. Ms.278
Turnout 48.2
Liberal Democrats gain from Conservative Swing
Conservative hold Swing

Henfield

Henfield
PartyCandidateVotes%±%
Independent Corp G.Unopposed
Conservative Howard M.Unopposed
Turnout N/A
Independent hold Swing
Conservative hold Swing

Holbrook

Holbrook
PartyCandidateVotes%±%
Conservative Darby E. Ms. 901 47.8 -1.5
Conservative Godwin G. 890
Labour Lamb P. Dr.53628.5+11.1
Liberal Democrats Millson A.44623.79.7
Labour Uwins S.420
Turnout 40.3
Conservative hold Swing

Itchingfield & Shipley

Itchingfield & Shipley
PartyCandidateVotes%±%
Conservative Vickers C. Ms. 520 67.4
Independent Keen D.25232.6
Turnout 39.1
Conservative hold Swing

Keen D. was elected in Itchingfield & Shipley as a Conservative in 1987, when this seat was last contested.

Nuthurst

Nuthurst
PartyCandidateVotes%±%
Conservative Walker S. Ms.Unopposed
Turnout N/A
Conservative win (new seat)

Pulborough & Coldwatham

Pulborough & Coldwatham
PartyCandidateVotes%±%
Conservative Copeman G.Unopposed
Conservative Pope J.Unopposed
Turnout N/A
Conservative hold Swing

Riverside

Riverside
PartyCandidateVotes%±%
Liberal Democrats Parminter K. Ms. 1,627 48.8 +7.1
Liberal Democrats Sully C. Ms. 1,377
Liberal Democrats White V. Ms. 1,282
Conservative Allcard D.1,13834.1-8.1
Conservative Watson B.1,077
Conservative Beagley P. Ms.1,031
Labour Barrett D.42712.8-3.3
Labour Richardson P.334
Labour Street M.332
Green Pinfold J.1454.3+4.3
Green King T.144
Turnout 46.3
Liberal Democrats gain from Conservative Swing
Liberal Democrats hold Swing

Roffey North

Roffey North
PartyCandidateVotes%±%
Conservative Hilliard D. 937 47.0 +0.2
Conservative Terner G. 804
Liberal Democrats Price B. Ms.62731.5-5.8
Labour Spottiswoode J. Ms.42921.5+5.5
Labour Gillians E.421
Turnout 41.4
Conservative hold Swing

Rudgwick

Rudgwick
PartyCandidateVotes%±%
Conservative Niven L. Ms. 510 56.0
Liberal Democrats Lawrence J. Ms.40144.0
Turnout 53.5
Conservative gain from Independent Swing

Rusper

Rusper
PartyCandidateVotes%±%
Conservative Kitchen E. Ms.Unopposed
Turnout N/A
Conservative hold Swing

Slinfold

Slinfold
PartyCandidateVotes%±%
Liberal Democrats Chisholm A. 307 48.9 +48.9
Conservative Mason D.22936.5-11.7
Ind. Conservative Shields N.9214.6+14.6
Turnout 47.0
Liberal Democrats gain from Conservative Swing

Southwater

Southwater
PartyCandidateVotes%±%
Liberal Democrats Stainton J. Ms. 1,418 56.3 +2.7
Liberal Democrats Stainton P. 1,273
Conservative Banks D.81632.4-8.9
Conservative Youtan J.631
Independent D'Singh D.28411.3+11.3
Turnout 46.0
Liberal Democrats hold Swing

Steyning

Steyning
PartyCandidateVotes%±%
Conservative Lee S. Ms. 1,021 44.9 +16.0
Conservative Ward M. Ms. 908
Liberal Democrats Clarke M. Ms.79034.7+16.0
Labour Drew D.46420.4+13.5
Labour Greenland P.334
Turnout 50.4
Conservative hold Swing
Conservative gain from Independent Swing

Storrington

Storrington
PartyCandidateVotes%±%
Liberal Democrats Walker L. 895 53.6 +22.9
Liberal Democrats Brain J. Ms. 852
Conservative Hyde M.77646.4-15.8
Conservative Blackman R. Ms.737
Turnout 42.4
Liberal Democrats gain from Conservative Swing

Sullington

Sullington
PartyCandidateVotes%±%
Liberal Democrats Banks D 693 71.0 +15.0
Conservative James J.28329.0-13.7
Turnout 56.8
Liberal Democrats hold Swing

Trafalgar

Trafalgar
PartyCandidateVotes%±%
Conservative Smith J. Ms. 1,152 47.2 -5.3
Conservative Howes D. 1,151
Conservative Miller M. Ms. 1,138
Liberal Democrats Allen J. Ms.61625.3-4.8
Liberal Democrats Horner P.568
Labour Brady E.40216.5-0.9
Labour Lacey R.314
Independent Owen E.26911.0+11.0
Turnout 52.9
Conservative hold Swing

Warnham

Warnham
PartyCandidateVotes%±%
Conservative Burnham J. Ms. 448 69.8 +7.5
Liberal Democrats Bell M. Ms.19430.2-4.0
Turnout 49.8
Conservative hold Swing

West Chiltington

West Chiltington
PartyCandidateVotes%±%
Conservative Cheshire J.Unopposed
Turnout N/A
Conservative hold Swing

West Grinstead

West Grinstead
PartyCandidateVotes%±%
Conservative McKenzie E. Ms.Unopposed
Turnout N/A
Conservative hold Swing

Related Research Articles

<span class="mw-page-title-main">Horsham District Council elections</span>

Horsham District Council in West Sussex, England, is elected every four years.

<span class="mw-page-title-main">West Sussex County Council</span> British administrative authority

West Sussex County Council (WSCC) is the authority that governs the non-metropolitan county of West Sussex. The county also contains seven district and borough councils, and 159 town, parish and neighbourhood councils. The county council has 70 elected councillors. The Chief Executive and their team of Executive Directors are responsible for the day-to-day running of the council.

<span class="mw-page-title-main">1991 United Kingdom local elections</span>

Local elections were held in the United Kingdom in 1991. The results were a setback for the governing Conservative Party, who were left with their lowest number of councillors since 1973 - though their popular vote was an improvement from the 1990 local elections, and the Conservatives would go on to win the general election in 1992.

The 2015 Horsham District Council election took place on 7 May 2015 to elect members of Horsham District Council in England. It was held on the same day as other local elections and the 2015 United Kingdom general election. The Conservatives secured a majority of 17, which was the largest majority any party has ever achieved at a Horsham District Council election.

<span class="mw-page-title-main">2011 Thanet District Council election</span>

Elections to elect all members (councillors) of Thanet District Council were held on 5 May 2011, as part of the 2011 United Kingdom local elections taking place simultaneously with the Alternative Vote Referendum. No political party won an overall majority of seats, meaning that the council went into 'No Overall Control' status for the first time since 1991. The Conservative Party ran a minority administration until December that year, when a Conservative councillor defected to the Independents group, enabling The Labour Party to run a minority administration until 2015. The District has as its main towns the beach resort towns of Ramsgate, Margate and Broadstairs.

The 2019 Bracknell Forest Borough Council election took place on 2 May 2019 to elect members of Bracknell Forest Borough Council in England.

The 2019 West Oxfordshire District Council election took place on 2 May 2019 to elect members of West Oxfordshire District Council in Oxfordshire, England. One third of the council was up for election and the Conservative Party stayed in overall control of the council.

<span class="mw-page-title-main">1991 Derby City Council election</span>

The 1991 Derby City Council election took place on 2 May 1991 to elect members of Derby City Council in England. Local elections were held in the United Kingdom in 1991. This was on the same day as other local elections. 15 of the council's 44 seats were up for election. The council, which had previously been under Conservative council, fell under no overall control with the Conservatives and Labour holding exactly half the seats each.

<span class="mw-page-title-main">2019 Horsham District Council election</span>

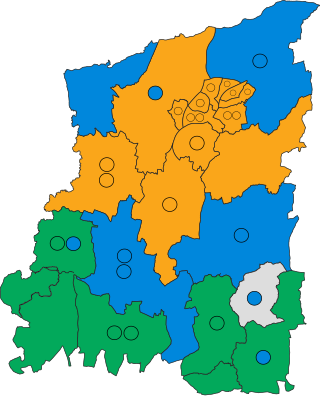
The 2019 Horsham District Council election took place on 2 May 2019 to elect members of Horsham District Council in England. It was held on the same day as other local elections. Every seat was contested and the Conservatives retained control of the council with a majority of 8.

The 1973 Horsham District Council election was the first ever for the council and took place on 7 June 1973 to elect members of Horsham District Council in England. It was held on the same day as other local elections. Independent councillors secured a majority of two with 23 seats, the Conservatives won 17 and the Liberal Party won 2. Labour also took part in the elections, fielding candidates in Horsham South & Horsham North only. The Liberal Party were successful in Broadbridge Heath and they were able to secure a seat in Storrington. The Conservative Party achieved good results in some rural areas but they were able to win the vast amount of their seats in the town. Independent councillors won a majority of seats in the villages in the district, sometimes unopposed, some later stood as a Conservative candidate three years later in the next set of elections for the Council.

The 1976 Horsham District Council election took place on 6 May 1976 to elect members of Horsham District Council in England. It was held on the same day as other local elections. The Conservatives won a majority of 9 on the council, gaining from Independent. In a number of seats, candidates who stood as an Independent in 1973, when these seats were last contested, stood again as a Conservative Party candidate. Residents' association won their first seat to the council, winning a seat in Henfield. The Liberal Party lost both of their seats from the previous election three years ago.

The 1979 Horsham District Council election took place on 3 May 1979 to elect members of Horsham District Council in England. It was held on the same day as other local elections and the 1979 United Kingdom general election. The Conservatives retained control of the council with 33 seats, a majority of 12. The Independents had eight councillors elected, a decrease of three from last time. The Liberals gained a seat in Bramber & Upper Beeding and the Residents' association held on to their Henfield seat.

The 1983 Horsham District Council election took place on 5 May 1983 to elect members of Horsham District Council in England. It was held on the same day as other local elections. The Conservatives retained control of the council with 35 seats, a majority of 14, Independent candidates won 5 seats and the SDP–Liberal Alliance won 2.

The 1987 Horsham District Council election took place on 7 May 1987 to elect members of Horsham District Council in England. It was held on the same day as other local elections. The Conservatives retained control of the council with 33 seats, a majority of 12. The SDP–Liberal Alliance won 6 seats and Independents won 4.

The 1995 Horsham District Council election took place on 4 May 1995 to elect members of Horsham District Council in England. It was held on the same day as other local elections. The Liberal Democrats gained control of the council from the Conservatives with a 3 seat majority. This was the first time ever the Conservative Party lost control of Horsham District Council since they first won overall control in 1976.

The 1999 Horsham District Council election took place on 6 May 1999 to elect members of Horsham District Council in England. It was held on the same day as other local elections. The Conservatives won a majority of 3 on the council, gaining from the Liberal Democrats.

The 2003 Horsham District Council election took place on 1 May 2003 to elect members of Horsham District Council in England. It was held on the same day as other local elections. The result left the council with no overall control with the Conservatives one seat short of a majority.

The 2007 Horsham District Council election took place on 3 May 2007 to elect members of Horsham District Council in England. It was held on the same day as other local elections. The Conservatives won a majority on the council, gaining from no overall control.

The 2011 Horsham District Council election took place on 5 May 2011 to elect members of Horsham District Council in England. It was held on the same day as other local elections and the 2011 United Kingdom Alternative Vote referendum. The Conservatives increased their majority on the council to 12, winning a total of 34 seats.

The 1991 Cheltenham Council election took place on 2 May 1991 to elect members of Cheltenham Borough Council in Gloucestershire, England. Due to local authority boundary changes a number of areas had been transferred from the Borough of Tewkesbury to the Borough of Cheltenham. Although most wards were unchanged, and continued to elect by thirds, three new wards were created, and had an all-up election: Leckhampton with Warden Hill, Prestbury and Swindon. Furthermore, the ward of Hatherley was abolished and recreated as Hatherley & The Reddings, and the number of councillors it elected was increased from three to four. This ward also had an all-out election.

References

  1. "Horsham District Council Election Results 1973-2011" (PDF). electionscentre.co.uk. Archived (PDF) from the original on 5 June 2020.