| |||||||||||||||||||||||||||||||||||||||||||||||||||||||||||
14 out of 37 seats to Worthing Borough Council 19 seats needed for a majority | |||||||||||||||||||||||||||||||||||||||||||||||||||||||||||
---|---|---|---|---|---|---|---|---|---|---|---|---|---|---|---|---|---|---|---|---|---|---|---|---|---|---|---|---|---|---|---|---|---|---|---|---|---|---|---|---|---|---|---|---|---|---|---|---|---|---|---|---|---|---|---|---|---|---|---|
| |||||||||||||||||||||||||||||||||||||||||||||||||||||||||||
Map of the results of the 2010 Worthing council election. Conservatives in blue and Liberal Democrats in yellow. | |||||||||||||||||||||||||||||||||||||||||||||||||||||||||||
|
The 2010 Worthing Borough Council election took place on 6 May 2010 to elect members of Worthing Borough Council in West Sussex, England. One third of the council was up for election and the Conservative Party stayed in overall control of the council. [1]
After the election, the composition of the council was:
Party | Seats | Gains | Losses | Net gain/loss | Seats % | Votes % | Votes | +/− | |
---|---|---|---|---|---|---|---|---|---|
Conservative | 8 | 2 | 2 | 0 | 57.1 | 46.4 | 25,011 | -4.1% | |
Liberal Democrats | 6 | 2 | 2 | 0 | 42.9 | 39.9 | 21,464 | +2.9% | |
UKIP | 0 | 0 | 0 | 0 | 0 | 7.4 | 3,977 | -0.3% | |
Labour | 0 | 0 | 0 | 0 | 0 | 6.25 | 3,365 | +3.15% | |
Party | Candidate | Votes | % | ±% | |
---|---|---|---|---|---|
Conservative | Victoria Vaughn | 1,774 | 41.30 | -6.30 | |
Liberal Democrats | James Nelson | 1,737 | 40.44 | -5.86 | |
Labour | John Turley | 446 | 10.38 | +3.98 | |
UKIP | Colin Avis | 318 | 7.40 | N/A | |
Rejected ballots | 20 | 0.48 | |||
Majority | 37 | 0.86 | -0.34 | ||
Turnout | 4,295 | 63 | +30 | ||
Conservative gain from Liberal Democrats | Swing | LD to Con 0.17 | |||
Party | Candidate | Votes | % | ±% | |
---|---|---|---|---|---|
Liberal Democrats | Trevor England | 2,199 | 58.08 | +2.08 | |
Conservative | Damon Turner | 1,542 | 40.72 | -3.28 | |
Rejected ballots | 45 | 1.20 | |||
Majority | 657 | 17.35 | +5.75 | ||
Turnout | 3,786 | 60 | +27 | ||
Liberal Democrats gain from Conservative | Swing | ||||
Party | Candidate | Votes | % | ±% | |
---|---|---|---|---|---|
Liberal Democrats | Davd Chapman | 1,603 | 42.94 | +2.64 | |
Conservative | Stephen Murray | 1,358 | 36.37 | -8.53 | |
Labour | Janet Haden | 505 | 13.52 | +5.12 | |
UKIP | Christopher Woodward | 242 | 6.48 | -0.62 | |
Rejected ballots | 25 | 0.69 | |||
Majority | 245 | 6.56 | +11.86 | ||
Turnout | 3733 | 54 | +26 | ||
Liberal Democrats gain from Conservative | Swing | ||||
Party | Candidate | Votes | % | ±% | |
---|---|---|---|---|---|
Conservative | Charles James | 1,303 | 45.18 | +4.18 | |
Liberal Democrats | Keith Sunderland | 1,259 | 43.65 | -2.00 | |
UKIP | Shaune Wilma | 310 | 10.50 | -3.30 | |
Rejected ballots | 25 | 0.87 | |||
Majority | 44 | 1.53 | +6.53 | ||
Turnout | 2,872 | 65 | +30 | ||
Conservative gain from Liberal Democrats | Swing | ||||
Party | Candidate | Votes | % | ±% | |
---|---|---|---|---|---|
Liberal Democrats | Alan Rice | 1,835 | 42.18 | -2.82 | |
Conservative | John Rogers | 1,708 | 39.26 | -8.24 | |
Labour | Matthew Smith | 463 | 10.64 | +4.14 | |
UKIP | John Harwood | 324 | 7.44 | N/A | |
Rejected ballots | 20 | 0.48 | |||
Majority | 127 | 2.91 | +6.41 | ||
Turnout | 4,350 | 64 | +32 | ||
Liberal Democrats hold | Swing | ||||
Party | Candidate | Votes | % | ±% | |
---|---|---|---|---|---|
Conservative | Steven Waight | 2,774 | 56.61 | -11.69 | |
Liberal Democrats | Neil Condon | 1,076 | 21.96 | +3.36 | |
Labour | James Elwood | 569 | 11.61 | -1.49 | |
UKIP | Richard Bater | 445 | 9.08 | N/A | |
Rejected ballots | 36 | 0.74 | |||
Majority | 1,698 | 34.65 | -14.95 | ||
Turnout | 4,900 | 72 | +30 | ||
Conservative hold | Swing | 7.475% Con to LD | |||
Party | Candidate | Votes | % | ±% | |
---|---|---|---|---|---|
Conservative | Carol Molineaux | 1,642 | 46.47 | -15.23 | |
Liberal Democrats | Wayne Hoban | 1,337 | 37.84 | -0.46 | |
Labour | Susan Marsh | 534 | 15.11 | N/A | |
Rejected ballots | 20 | 0.58 | |||
Majority | 307 | 8.63 | -14.77 | ||
Turnout | 3,533 | 56 | +28 | ||
Conservative hold | Swing | 7.375% Con to LD | |||
Party | Candidate | Votes | % | ±% | |
---|---|---|---|---|---|
Conservative | Thomas Wye | 2,339 | 30.50 | ||
Conservative | Paul Yallop | 1,981 | 25.83 | ||
Liberal Democrats | Christine Allen | 1,467 | 19.12 | ||
Liberal Democrats | Yvonne Leonard | 1,339 | 17.45 | ||
UKIP | Phillip Ruddock | 510 | 6.64 | ||
Rejected ballots | 34 | 0.46 | |||
Majority | 872 | 11.36 | |||
Majority | 514 | 6.70 | |||
Turnout | 7,670 | 65 | +32 | ||
Conservative hold | Swing | ||||
Party | Candidate | Votes | % | ±% | |
---|---|---|---|---|---|
Liberal Democrats | Diane Jones | 1,011 | 53.57 | ||
Conservative | Alan Whitley | 861 | 45.62 | ||
Rejected ballots | 15 | 0.81 | |||
Majority | 150 | 7.95 | |||
Turnout | 1,887 | 53 | +27 | ||
Liberal Democrats hold | Swing | ||||
Party | Candidate | Votes | % | ±% | |
---|---|---|---|---|---|
Conservative | Reginald Green | 2,617 | 56.25 | ||
Liberal Democrats | Michael Cranefield | 1,124 | 24.16 | ||
UKIP | Michael Glennon | 496 | 10.66 | ||
Labour | John Gardiner | 384 | 8.25 | ||
Rejected ballots | 31 | 0.68 | |||
Majority | 1,493 | 31.09 | |||
Turnout | 4,652 | 74 | +36 | ||
Conservative hold | Swing | ||||
Party | Candidate | Votes | % | ±% | |
---|---|---|---|---|---|
Conservative | Nicola Waight | 2,343 | 50.59 | ||
Liberal Democrats | Jacqueline Cranefield | 1,659 | 35.82 | ||
UKIP | Patricia Hall | 589 | 12.71 | ||
Rejected ballots | 40 | 0.88 | |||
Majority | 684 | 14.77 | |||
Turnout | 4,631 | 64 | +32 | ||
Conservative hold | Swing | ||||
Party | Candidate | Votes | % | ±% | |
---|---|---|---|---|---|
Liberal Democrats | Christine Brown | 1,702 | 45.68 | ||
Conservative | Jane Rogers | 1,273 | 35.82 | ||
Labour | Ann Saunders | 464 | 12.45 | ||
UKIP | Rita Offen | 264 | 7.09 | ||
Rejected ballots | 23 | 0.61 | |||
Majority | 429 | 11.51 | |||
Turnout | 3,726 | 60 | +21 | ||
Liberal Democrats hold | Swing | ||||
Party | Candidate | Votes | % | ±% | |
---|---|---|---|---|---|
Liberal Democrats | Robert Smytherman | 2,166 | 52.50 | ||
Conservative | Timothy Chick | 1,496 | 35.31 | ||
UKIP | Anthony Fallone | 479 | 11.27 | ||
Rejected ballots | 21 | 0.50 | |||
Majority | 670 | 17.19 | |||
Turnout | 4,162 | 64 | +33 | ||
Liberal Democrats hold | Swing | ||||
Worthing West is a constituency represented in the House of Commons of the UK Parliament since its 1997 creation by Sir Peter Bottomley, a Conservative, who is the Father of the House of Commons.
The 1998 Worthing Borough Council election took place on 7 May 1998 to elect members of Worthing Borough Council in West Sussex, England. One third of the council was up for election and the Liberal Democrat party kept overall control of the council.
The 1999 Worthing Borough Council election took place on 6 May 1999 to elect members of Worthing Borough Council in West Sussex, England. One third of the council was up for election and the Conservative Party gained overall control of the council from the Liberal Democrats. Overall turnout was 34.8%.
The 2000 Worthing Borough Council election took place on 4 May 2000 to elect members of Worthing Borough Council in West Sussex, England. One third of the council was up for election and the Conservative Party held overall control of the council.
The 2002 Worthing Borough Council election took place on 2 May 2002 to elect members of Worthing Borough Council in West Sussex, England. One third of the council was up for election and the Liberal Democrats gained overall control of the council from the Conservative Party. Overall turnout was 30.67%.
The 2003 Worthing Borough Council election took place on 1 May 2003 to elect members of Worthing Borough Council in West Sussex, England. One third of the council was up for election and the Liberal Democrats lost overall control of the council to no overall control. Overall turnout was 28.61%.
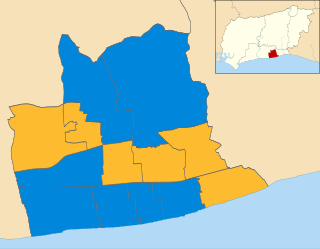
The 2006 Worthing Borough Council election took place on 4 May 2006 to elect members of Worthing Borough Council in West Sussex, England. One third of the council was up for election and the Conservative Party stayed in overall control of the council.
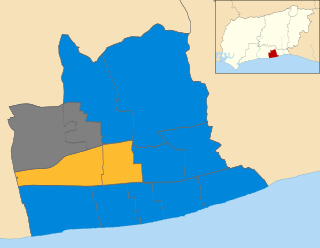
The 2007 Worthing Borough Council election took place on 3 May 2007 to elect members of Worthing Borough Council in West Sussex, England. One third of the council was up for election and the Conservative Party stayed in overall control of the council.
The 2008 Worthing Borough Council election took place on 1 May 2008 to elect members of Worthing Borough Council in West Sussex, England. One third of the council was up for election and the Conservative Party stayed in overall control of the council. Overall turnout was 35%.
The 2010 Barnet Council election took place on 6 May 2010 to elect members of Barnet London Borough Council in London, England. The whole council was up for election and the Conservative party stayed in overall control of the council.
The 2010 Adur District Council election took place on 6 May 2010 to elect members of Adur District Council in West Sussex, England. Half of the council was up for election and the Conservative Party stayed in overall control of the council.
The 2006 Rushmoor Council election took place on 4 May 2006 to elect members of Rushmoor Borough Council in Hampshire, England. One third of the council was up for election and the Conservative Party stayed in overall control of the council.
The 2006 Solihull Metropolitan Borough Council election took place on 4 May 2006 to elect members of Solihull Metropolitan Borough Council in the West Midlands, England. One third of the council was up for election and the Conservative Party stayed in overall control of the council.
The 2010 Pendle Borough Council election took place on 6 May 2010 to elect members of Pendle Borough Council in Lancashire, England. One third of the council was up for election and the council stayed under no overall control.
The 2010 Woking Council election took place on 6 May 2010, on the same day as the 2010 general election, to elect members of Woking Borough Council in Surrey, England. One third of the council was up for election and the council stayed under no overall control.
The 2010 Barrow-in-Furness Borough Council election took place on 6 May 2010 to elect members of Barrow-in-Furness Borough Council in Cumbria, England. One third of the council was up for election and the council stayed under no overall control.
The 2011 Worthing Borough Council election took place on 5 May 2011 to elect members of Worthing Borough Council in West Sussex, England. One third of the council was up for election, with the exception of the two member wards of Durrington and Northbrook. The Conservative Party retained overall control of the council.
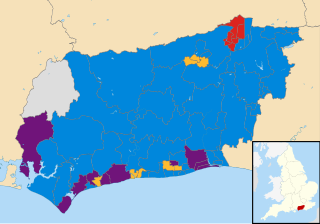
The West Sussex County Council election, 2013 took place on 2 May 2013, as part of the 2013 United Kingdom local elections. All 71 electoral divisions were up for election, which returned one county councillor each by first-past-the-post voting for a four-year term of office. At this election, the Conservative Party was seeking to retain overall control of the council, and the Liberal Democrats to maintain their position as the main opposition party.
The 2021 Worthing Borough Council election took place on 6 May 2021 to elect members of Worthing Borough Council, on the same day as other UK local elections. This election was originally scheduled to take place on 7 May 2020, but was delayed a year due to the COVID-19 pandemic; 2021 was originally scheduled to be an off-year for Worthing Borough Council elections. A third of the council was up for election, a total of 13 councillors. Candidates elected in 2016 had their term expire at this election.
The 2022 Worthing Borough Council election took place on 5 May 2022 to elect members of Worthing Borough Council, on the same day as other UK local elections.