The 2010 Wyre Forest District Council election took place on 6 May 2010 to elect members of Wyre Forest District Council in Worcestershire, England. One third of the council was up for election and the Conservative Party gained overall control of the council from no overall control. [1]
After the election, the composition of the council was:
Overall turnout at the election was 65.6%. [3]
Party | Seats | Gains | Losses | Net gain/loss | Seats % | Votes % | Votes | +/− | |
---|---|---|---|---|---|---|---|---|---|
Conservative | 9 | 2 | 0 | +2 | 64.3 | 39.1 | 18,175 | -2.0% | |
Health Concern | 3 | 0 | 2 | -2 | 21.4 | 24.8 | 11,517 | +0.1% | |
Liberal | 2 | 0 | 0 | 0 | 14.3 | 6.9 | 3,216 | -3.5% | |
Labour | 0 | 0 | 0 | 0 | 0 | 18.6 | 8,657 | +4.8% | |
Liberal Democrats | 0 | 0 | 0 | 0 | 0 | 9.0 | 4,190 | +2.7% | |
Green | 0 | 0 | 0 | 0 | 0 | 1.6 | 765 | +1.6% | |
Party | Candidate | Votes | % | ±% | |
---|---|---|---|---|---|
Conservative | John Aston | 1,349 | 38.1 | +9.8 | |
Liberal Democrats | David Ross | 1,216 | 34.3 | -15.7 | |
Health Concern | Peter Young | 591 | 16.7 | +0.9 | |
Labour | Leroy Wright | 386 | 10.9 | +4.9 | |
Majority | 133 | 3.8 | |||
Turnout | 3,542 | 68.0 | +33.0 | ||
Conservative hold | Swing | ||||
Party | Candidate | Votes | % | ±% | |
---|---|---|---|---|---|
Health Concern | Nigel Thomas | 1,176 | 38.8 | +9.6 | |
Conservative | Kenneth Henderson | 1,096 | 36.2 | +1.0 | |
Labour | Violet Higgs | 757 | 25.0 | -7.8 | |
Majority | 80 | 2.6 | |||
Turnout | 3,029 | 66.1 | +25.2 | ||
Health Concern hold | Swing | ||||
Party | Candidate | Votes | % | ±% | |
---|---|---|---|---|---|
Conservative | Stephen Clee | 1,550 | 39.9 | -2.2 | |
Health Concern | Derek Killingworth | 1,070 | 27.5 | +7.5 | |
Liberal Democrats | Dorothy Smith | 715 | 18.4 | +18.4 | |
Labour | Samuel Arnold | 549 | 14.1 | +0.0 | |
Majority | 480 | 12.4 | -5.9 | ||
Turnout | 3,884 | 72.9 | +31.9 | ||
Conservative hold | Swing | ||||
Party | Candidate | Votes | % | ±% | |
---|---|---|---|---|---|
Conservative | Pauline Hayward | 1,685 | 67.4 | ||
Health Concern | Elizabeth Davies | 572 | 22.9 | ||
Labour | Diana Udall | 243 | 9.7 | ||
Majority | 1,113 | 44.5 | |||
Turnout | 2,500 | 76.5 | |||
Conservative hold | Swing | ||||
Party | Candidate | Votes | % | ±% | |
---|---|---|---|---|---|
Health Concern | Howard Martin | 1,345 | 38.4 | +13.6 | |
Conservative | Steven Walker | 1,147 | 32.7 | +0.2 | |
Labour | Adrian Sewell | 781 | 22.3 | +12.6 | |
Green | John Harris | 233 | 6.6 | +6.6 | |
Majority | 198 | 5.6 | |||
Turnout | 3,506 | 59.0 | +29.1 | ||
Health Concern hold | Swing | ||||
Party | Candidate | Votes | % | ±% | |
---|---|---|---|---|---|
Conservative | Daniel McCann | 1,374 | 36.7 | -18.2 | |
Labour | Nigel Knowles | 943 | 25.2 | +10.4 | |
Health Concern | Michael Shellie | 884 | 23.6 | -2.9 | |
Liberal Democrats | Michael Dixon | 446 | 11.9 | +11.9 | |
Green | Phillip Oliver | 94 | 2.5 | +2.5 | |
Majority | 431 | 11.5 | -16.9 | ||
Turnout | 3,741 | 68.8 | +31.0 | ||
Conservative gain from Health Concern | Swing | ||||
Party | Candidate | Votes | % | ±% | |
---|---|---|---|---|---|
Liberal | Timothy Ingham | 1,567 | 41.7 | -10.5 | |
Conservative | Christopher Morrall | 1,181 | 31.4 | +12.5 | |
Labour | Paul Mills | 762 | 20.3 | +11.6 | |
Green | Alexandra Heelis | 248 | 6.6 | +6.6 | |
Majority | 386 | 10.3 | -21.7 | ||
Turnout | 3,758 | 61.8 | +32.3 | ||
Liberal hold | Swing | ||||
Party | Candidate | Votes | % | ±% | |
---|---|---|---|---|---|
Conservative | Ian Hardiman | 1,275 | 36.8 | -2.8 | |
Labour | Barry McFarland | 842 | 24.3 | -2.1 | |
Health Concern | Gillian Carr | 814 | 23.5 | +1.8 | |
Liberal Democrats | Clare Cassidy | 458 | 13.2 | +13.2 | |
Green | David Finch | 78 | 2.2 | +2.2 | |
Majority | 433 | 12.5 | -0.7 | ||
Turnout | 3,467 | 66.8 | +26.8 | ||
Conservative gain from Health Concern | Swing | ||||
Party | Candidate | Votes | % | ±% | |
---|---|---|---|---|---|
Health Concern | Dixon Sheppard | 1,517 | 42.0 | -7.6 | |
Conservative | Michael Freeman | 1,420 | 39.3 | -0.6 | |
Labour | Jennifer Knowles | 676 | 18.7 | +8.2 | |
Majority | 97 | 2.7 | -7.0 | ||
Turnout | 3,613 | 66.2 | +32.2 | ||
Health Concern hold | Swing | ||||
Party | Candidate | Votes | % | ±% | |
---|---|---|---|---|---|
Conservative | Michael Salter | 1,802 | 46.0 | -0.2 | |
Health Concern | Clifford Brewer | 1,402 | 35.8 | -2.8 | |
Labour | Gary Watson | 717 | 18.3 | +6.8 | |
Majority | 400 | 10.2 | +2.6 | ||
Turnout | 3,921 | 67.4 | +33.4 | ||
Conservative hold | Swing | ||||
Party | Candidate | Votes | % | ±% | |
---|---|---|---|---|---|
Liberal | Rosemary Bishop | 1,649 | 45.2 | -6.7 | |
Conservative | Christopher Rogers | 1,046 | 28.7 | +1.2 | |
Labour | Matthew Nicholls | 489 | 13.4 | +5.0 | |
Health Concern | Raymond Barber | 465 | 12.7 | +0.5 | |
Majority | 603 | 16.5 | -7.9 | ||
Turnout | 3,649 | 68.3 | +31.3 | ||
Liberal hold | Swing | ||||
Party | Candidate | Votes | % | ±% | |
---|---|---|---|---|---|
Conservative | Nichola Gale | 584 | 33.4 | -17.0 | |
Labour | Dan Watson | 415 | 23.7 | +10.0 | |
Liberal Democrats | Adrian Beavis | 378 | 21.6 | +6.6 | |
Health Concern | Caroline Shellie | 373 | 21.3 | +0.5 | |
Majority | 169 | 9.7 | -19.9 | ||
Turnout | 1,750 | 47.5 | +19.6 | ||
Conservative hold | Swing | ||||
Party | Candidate | Votes | % | ±% | |
---|---|---|---|---|---|
Conservative | John-Paul Campion | 1,409 | 42.2 | -17.4 | |
Liberal Democrats | Samantha Walker | 612 | 18.3 | +9.3 | |
Labour | David Prain | 605 | 18.1 | +8.8 | |
Health Concern | John Griffiths | 603 | 18.0 | -4.1 | |
Green | Michael Whitbread | 112 | 3.4 | +3.4 | |
Majority | 797 | 23.9 | -13.6 | ||
Turnout | 3,341 | 59.5 | +25.5 | ||
Conservative hold | Swing | ||||
Party | Candidate | Votes | % | ±% | |
---|---|---|---|---|---|
Conservative | Gordon Yarranton | 1,257 | 44.6 | -2.9 | |
Health Concern | Linda Candlin | 705 | 25.0 | -4.8 | |
Labour | Dean Cox | 492 | 17.5 | -1.5 | |
Liberal Democrats | John Stephen | 365 | 12.9 | +12.9 | |
Majority | 552 | 19.6 | +1.9 | ||
Turnout | 2,819 | 71.2 | +32.0 | ||
Conservative hold | Swing | ||||
Independent Community & Health Concern, abbr.ICHC, is a political party based in Kidderminster, United Kingdom. The party was founded in 2000, having grown out of the campaign to restore the casualty unit at Kidderminster Hospital. Since 2015 it has successfully contested local elections within the Wyre Forest local government area, which includes Kidderminster.
Wyre Forest is a county constituency represented in the House of Commons of the Parliament of the United Kingdom. It elects one Member of Parliament (MP) by the first past the post system of election. The current MP is Mark Garnier of the Conservative Party who was re-elected in the 2019 general election.
The 1998 Wyre Forest District Council election took place on 7 May 1998 to elect members of Wyre Forest District Council in Worcestershire, England. One-third of the council was up for election and the Labour Party stayed in overall control of the council.
The 1999 Wyre Forest District Council election took place on 6 May 1999 to elect members of Wyre Forest District Council in Worcestershire, England. One third of the council was up for election and the Labour Party lost overall control of the council to no overall control.
The 2000 Wyre Forest District Council election took place on 4 May 2000 to elect members of Wyre Forest District Council in Worcestershire, England. One third of the council was up for election and the council stayed under no overall control.
The 2002 Wyre Forest District Council election took place on 2 May 2002 to elect members of Wyre Forest District Council in Worcestershire, England. One third of the council was up for election and the Independent Kidderminster Hospital and Health Concern party gained overall control of the council from no overall control.
The 2003 Wyre Forest District Council election took place on 1 May 2003 to elect members of Wyre Forest District Council in Worcestershire, England. One third of the council was up for election and the council stayed under no overall control.
The 2004 Wyre Forest District Council election took place on 10 June 2004 to elect members of Wyre Forest District Council in Worcestershire, England. The whole council was up for election with boundary changes since the last election in 2003. The council stayed under no overall control, but with the Conservatives taking over as the largest party on the council from the Health Concern party.
The 2006 Wyre Forest District Council election took place on 4 May 2006 to elect members of Wyre Forest District Council in Worcestershire, England. One third of the council was up for election and the council stayed under no overall control.
The 2007 Wyre Forest District Council election took place on 3 May 2007 to elect members of Wyre Forest District Council in Worcestershire, England. One third of the council was up for election and the council stayed under no overall control.
The 2008 Wyre Forest District Council election took place on 1 May 2008 to elect members of Wyre Forest District Council in Worcestershire, England. One third of the council was up for election and the Conservative Party gained overall control of the council from no overall control.
The 2010 Craven District Council election took place on 6 May 2010 to elect members of Craven District Council in North Yorkshire, England. One third of the council was up for election and the Conservative party gained overall control of the council from no overall control.
The 2010 Harlow District Council election took place on 6 May 2010 to elect members of Harlow District Council in Essex, England. One third of the council was up for election and the Conservative party stayed in overall control of the council.
The 2011 Harlow District Council election took place on 5 May 2011 to elect members of Harlow District Council in Essex, England. One third of the council was up for election and the Conservative Party stayed in overall control of the council.
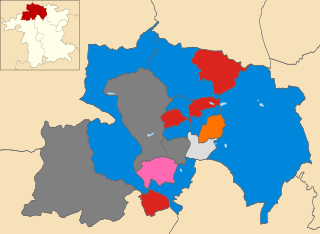
The 2011 Wyre Forest District Council election took place on 5 May 2011 to elect members of Wyre Forest District Council in Worcestershire, England. One third of the council was up for election and the Conservative Party stayed in overall control of the council.
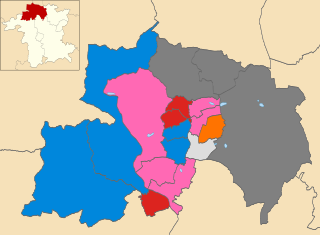
The 2012 Wyre Forest District Council election took place on 3 May 2012 to elect members of Wyre Forest District Council in Worcestershire, England. One third of the council was up for election and the Conservative Party lost overall control of the council to no overall control.
The 2014 Wyre Forest District Council election took place on 22 May 2014 to elect members of Wyre Forest District Council in Worcestershire, England. One third of the council was up for election and the council stayed under no overall control.
The 2015 Wyre Forest District Council election took place on 7 May 2015 to elect members of Wyre Forest District Council in Worcestershire, England. The whole council was up for election after boundary changes reduced the number of seats by nine. The Conservative Party gained overall control of the council from no overall control.
The 2023 United Kingdom local elections were held on Thursday, 4 May 2023 in England and on Thursday 18 May 2023 in Northern Ireland. These included district councils, unitary authorities, and directly elected mayors in England, and included all local councils in Northern Ireland. Notably, these elections were the first to be held under the Elections Act 2022, a new voter identification law that required voters to show photo ID when attending a polling station, and was a cause for controversy.
The 2023 Wyre Forest District Council election took place on 4 May 2023, to elect all 33 members of Wyre Forest District Council in Worcestershire, England. This was on the same day as other local elections across England.