This article needs additional citations for verification .(February 2024) |
Elections to North Tyneside Metropolitan Council took place on 6 May 2010 on the same day as other council elections in England and the UK general election.
North Tyneside Council is elected "in thirds" which means one councillor from each three-member ward is elected each year with a fourth year when the mayoral election takes place.
One third of the councillors were elected in 2006. The Conservative Party gained an overall majority of one on the council after the 2008 election which previously had been under no overall control, and also won the following mayoral election, in which Linda Arkley returned to office. The 2010 election proved victorious for the Labour Party, which gained 8 seats and lost none. The Conservatives lost 7 seats and the Liberal Democrats lost one. The Council returned to no overall control as the Conservatives lost their majority and fell into second place. The swing across the council on average was 10.7% from the Conservatives to Labour, against the national trend of the Westminster elections taking place the same day.
Party | Seats | Gains | Losses | Net gain/loss | Seats % | Votes % | Votes | +/− | |
---|---|---|---|---|---|---|---|---|---|
Labour | 29 | 8 | 0 | +8 | 48.3 | 49.1 | 48,272 | +11.6% | |
Conservative | 24 | 0 | 7 | -7 | 40 | 32.5 | 31,897 | -9.7% | |
Liberal Democrats | 7 | 0 | 1 | -1 | 11.7 | 15.1 | 14,831 | -0.5% | |
Green | 0 | 0 | 0 | 0 | 0 | 1.3 | 1,296 | +1.1% | |
BNP | 0 | 0 | 0 | 0 | 0 | 1.2 | 1,209 | -0.9% | |
National Front | 0 | 0 | 0 | 0 | 0 | 0.57 | 562 | +0.15% | |
English Democrat | 0 | 0 | 0 | 0 | 0 | 0.21 | 206 | +0.21% | |
Party | Candidate | Votes | % | ±% | |
---|---|---|---|---|---|
Labour | David McGarr | 2,335 | 46.8 | +10.3 | |
Liberal Democrats | Dorothy Bradley | 2,065 | 41.4 | -11.9 | |
Conservative | Ian Wallace | 586 | 11.8 | +11.8 | |
Majority | 270 | 5.4 | -11.1 | ||
Turnout | 4,986 | 61.2 | +23.3 | ||
Labour gain from Liberal Democrats | Swing | +11.1 | |||
A further by-election was held in September 2010. Details can be found here.
Party | Candidate | Votes | % | ±% | |
---|---|---|---|---|---|
Labour | Stuart Hill | 2,444 | 46.6 | +5.5 | |
Conservative | Philip Wilson | 1,799 | 34.3 | -15.8 | |
Liberal Democrats | Clare Barton | 1,002 | 19.1 | +9.6 | |
Majority | 645 | 12.3 | +2.6 | ||
Turnout | 5,245 | 66.7 | +19.9 | ||
Labour gain from Conservative | Swing | +10.7 | |||
Party | Candidate | Votes | % | ±% | |
---|---|---|---|---|---|
Labour | Ann Arkle | 2,675 | 58.5 | +5.5 | |
Conservative | Martyn Peggs | 814 | 17.8 | -5 | |
Liberal Democrats | Robert Watson | 746 | 16.3 | +6.9 | |
BNP | Gordon Steel | 313 | 6.8 | -7.9 | |
Majority | 1,861 | 40.7 | +10.3 | ||
Turnout | 4,574 | 58.1 | +25.5 | ||
Labour hold | Swing | +5.8 | |||
Party | Candidate | Votes | % | ±% | |
---|---|---|---|---|---|
Labour | Amanda Normand | 3,375 | 77.4 | +23 | |
Conservative | Edith Furness | 988 | 22.6 | -7.4 | |
Majority | 2,387 | 54.7 | +30.3 | ||
Turnout | 4,363 | 53.3 | +22.7 | ||
Labour hold | Swing | +15.2 | |||
Party | Candidate | Votes | % | ±% | |
---|---|---|---|---|---|
Labour | Steven Cox | 3,196 | 62.2 | +19.6 | |
Conservative | Jules Emberton | 2,120 | 37.8 | -19.6 | |
Majority | 1,076 | 20.1 | +5.3 | ||
Turnout | 5,316 | 65.3 | +25.5 | ||
Labour gain from Conservative | Swing | +19.6 | |||
Party | Candidate | Votes | % | ±% | |
---|---|---|---|---|---|
Conservative | Kenneth Barrie | 2,741 | 48.2 | -25.4 | |
Labour | Keith Smiles | 2,436 | 42.8 | +16.4 | |
Green | Malcolm Scott | 510 | 9 | +9 | |
Majority | 305 | 5.4 | -41.8 | ||
Turnout | 5,687 | 76 | +26 | ||
Conservative hold | Swing | -20.9 | |||
Party | Candidate | Votes | % | ±% | |
---|---|---|---|---|---|
Labour | Maureen Madden | 2,424 | 56.3 | -2.1 | |
Liberal Democrats | Paul Moat | 1,105 | 25.7 | -20.1 | |
Conservative | Leon Rodda | 433 | 10.1 | +10.1 | |
National Front | Bob Batten | 345 | 7.9 | +7.9 | |
Majority | 1,319 | 30.6 | +22.1 | ||
Turnout | 4,307 | 56.3 | +24.9 | ||
Labour hold | Swing | +9 | |||
Party | Candidate | Votes | % | ±% | |
---|---|---|---|---|---|
Labour | Linda Darke | 2,445 | 49.8 | +9.5 | |
Conservative | Paul Bunyan | 1,570 | 32 | -16.4 | |
Liberal Democrats | Norma Playle | 893 | 18.2 | +6.9 | |
Majority | 875 | 17.8 | +9.8 | ||
Turnout | 4,908 | 65.5 | +26.9 | ||
Labour hold | Swing | +13 | |||
Party | Candidate | Votes | % | ±% | |
---|---|---|---|---|---|
Labour | Joan Walker | 2,530 | 54.2 | -10.3 | |
Liberal Democrats | Ronald Fletcher | 965 | 20.7 | +20.7 | |
Conservative | Robin Underwood | 746 | 16 | -8.1 | |
National Front | Mark Nicholls | 217 | 4.5 | -6.9 | |
English Democrat | Martin Thompson | 206 | 4.4 | +4.4 | |
Majority | 1,565 | 33.6 | -6.8 | ||
Turnout | 4,664 | 57.5 | +20.8 | ||
Labour hold | Swing | -15.5 | |||
Party | Candidate | Votes | % | ±% | |
---|---|---|---|---|---|
Conservative | Leslie Miller | 2,464 | 46.6 | -23 | |
Labour | Glenn Stillaway | 1,745 | 33 | +15.2 | |
Liberal Democrats | Eleanor Jellett | 1,084 | 20.5 | +12 | |
Majority | 719 | 13.6 | -38.3 | ||
Turnout | 5,293 | 76.5 | +52.4 | ||
Conservative hold | Swing | -19.1 | |||
Party | Candidate | Votes | % | ±% | |
---|---|---|---|---|---|
Labour | Ian Grayson | 2,403 | 43.4 | +3.8 | |
Conservative | Frank Austin | 1,880 | 40 | -12.2 | |
Liberal Democrats | Charles Hall | 869 | 15.7 | +7.5 | |
BNP | Dorothy Brooke | 224 | 4 | +4 | |
Green | Julia Erskine | 157 | 2.8 | +2.8 | |
Majority | 523 | 9.5 | -3.2 | ||
Turnout | 5,533 | 81.3 | +32 | ||
Labour gain from Conservative | Swing | +8 | |||
Party | Candidate | Votes | % | ±% | |
---|---|---|---|---|---|
Liberal Democrats | Marian Huscroft | 2,035 | 50.7 | -15.3 | |
Labour | Alan Keith | 1,509 | 37.6 | +13.4 | |
Conservative | Barbara Bake | 468 | 11.7 | +1.9 | |
Majority | 526 | 13.1 | -28.7 | ||
Turnout | 4,012 | 59.3 | +20.6 | ||
Liberal Democrats hold | Swing | -14.4 | |||
Party | Candidate | Votes | % | ±% | |
---|---|---|---|---|---|
Labour | Kate Osborne | 2,529 | 51.7 | +27.1 | |
Conservative | Susan Rodgerson | 2,367 | 48.3 | -7.5 | |
Majority | 162 | 3.3 | -27.9 | ||
Turnout | 4,896 | 71.4 | +41.6 | ||
Labour gain from Conservative | Swing | +17.3 | |||
Party | Candidate | Votes | % | ±% | |
---|---|---|---|---|---|
Labour | Bruce Pickard | 2,220 | 54.6 | +1.7 | |
Liberal Democrats | Andy Hudson | 1,058 | 26 | +2.8 | |
Conservative | Brian Steward | 791 | 19.4 | +3.1 | |
Majority | 1,162 | 28.6 | -1.1 | ||
Turnout | 4,069 | 51 | +17.2 | ||
Labour hold | Swing | -0.6 | |||
Party | Candidate | Votes | % | ±% | |
---|---|---|---|---|---|
Conservative | Pam McIntyre | 3,665 | 67.4 | -16 | |
Labour | Patricia Crowe | 1,363 | 25.1 | +8.5 | |
Green | Susie Rutherford | 407 | 7.5 | +7.5 | |
Majority | 2,302 | 42.4 | -24.5 | ||
Turnout | 5,435 | 78.8 | +24 | ||
Conservative hold | Swing | -12.3 | |||
Party | Candidate | Votes | % | ±% | |
---|---|---|---|---|---|
Labour | Sarah Day | 3,040 | 51.2 | +22.8 | |
Conservative | Ian Macaulay | 2,896 | 48.8 | -13.4 | |
Majority | 144 | 2.4 | -21.5 | ||
Turnout | 5,936 | 72.3 | +42.2 | ||
Labour gain from Conservative | Swing | +18.1 | |||
Party | Candidate | Votes | % | ±% | |
---|---|---|---|---|---|
Labour | Brian Burdis | 2,999 | 63.2 | +18.7 | |
Conservative | Joanne Johnson | 1,232 | 26 | +1 | |
BNP | John Burrows | 513 | 10.8 | -0.5 | |
Majority | 1,767 | 37.2 | +17.7 | ||
Turnout | 4,744 | 61 | +22.2 | ||
Labour hold | Swing | +8.9 | |||
Party | Candidate | Votes | % | ±% | |
---|---|---|---|---|---|
Liberal Democrats | Margaret Finlay | 1,987 | 45 | -15.9 | |
Labour | Gary Bell | 1,742 | 39.5 | +18.3 | |
Conservative | Miriam Smith | 461 | 10.4 | +3.5 | |
Green | Martin Collins | 222 | 5 | +5 | |
Majority | 245 | 5.6 | -34.1 | ||
Turnout | 4,412 | 57.6 | +17.9 | ||
Liberal Democrats hold | Swing | -17.1 | |||
Party | Candidate | Votes | % | ±% | |
---|---|---|---|---|---|
Labour | Alex Cowie | 2,944 | 58.6 | +17.3 | |
Conservative | George Westwater | 2,076 | 41.4 | -6 | |
Majority | 868 | 17.3 | +11.2 | ||
Turnout | 5,020 | 67.3 | +19 | ||
Labour gain from Conservative | Swing | +11.7 | |||
Party | Candidate | Votes | % | ±% | |
---|---|---|---|---|---|
Labour | Pamela Brooks | 1,918 | 39.4 | +4.7 | |
Conservative | Paul Mason | 1,800 | 36.9 | -28.4 | |
Liberal Democrats | John Webb | 995 | 20.4 | +20.4 | |
BNP | Jeff Rutherford | 159 | 3.3 | +3.3 | |
Majority | 118 | 2.4 | -28.5 | ||
Turnout | 4,872 | 69.8 | +29.8 | ||
Labour gain from Conservative | Swing | +16.6 | |||
The city of Bristol, England, is a unitary authority, represented by four MPs representing seats wholly within the city boundaries. As well as these, Filton and Bradley Stoke covers the northern urban fringe in South Gloucestershire and the north eastern urban fringe is in the Kingswood constituency. The overall trend of both local and national representation became left of centre during the latter 20th century, but there was a shift to the right in the 2010 general election. The city has a tradition of local activism, with environmental issues and sustainable transport being prominent issues in the city.
Elections to North Tyneside Metropolitan Council took place on 3 May 2007 on the same day as other local council elections in England.
Elections to North Tyneside Metropolitan Council took place on 1 May 2008 on the same day as other local council elections in England.
Elections to the Borough Council in Slough, England, were held on 1 May 2008. This was the 123rd Slough general local authority election since Slough became a local government unit in 1863.
Elections to North Tyneside Metropolitan Council took place on 5 May 2011 on the same day as other council elections in England and the UK AV referendum.
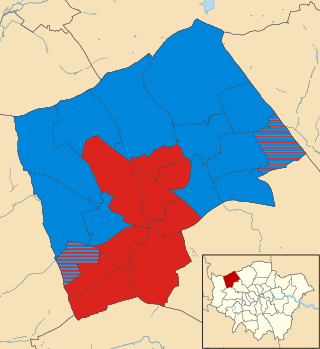
The 2006 St Albans City and District Council election took place on 4 May 2006 to elect members of St Albans District Council in Hertfordshire, England. One third of the council was up for election and the Liberal Democrats gained overall control of the council from no overall control.
The 2012 Scottish local elections were held on 3 May 2012 in all 32 local authorities. The Scottish National Party (SNP) overtook Labour to win the highest share of the vote, and retained and strengthened its position as the party with most councillors. Labour also made gains, while the Liberal Democrats experienced meltdown, losing over half their seats and falling behind the Conservatives. For the first time since the introduction of the Single Transferable Vote system, the SNP won majority control of 2 councils, from no overall control. Labour also won majority control of 2 councils from no overall control, while retaining majority control over 2 councils.
The 2003 South Tyneside Metropolitan Borough Council election took place on 1 May 2003 to elect members of South Tyneside Metropolitan Borough Council in Tyne and Wear, England. One third of the council was up for election and the Labour Party kept overall control of the council.
The 2004 South Tyneside Metropolitan Borough Council election took place on 10 June 2004 to elect members of South Tyneside Metropolitan Borough Council in Tyne and Wear, England. The whole council was up for election with boundary changes since the last election in 2003 reducing the number of seats by 6. The Labour Party stayed in overall control of the council.
The 2008 Sunderland Council election took place on 1 May 2008 to elect members of Sunderland Metropolitan Borough Council in Tyne and Wear, England. One third of the council was up for election and the Labour Party stayed in overall control of the council.
The 2010 Sunderland Council election took place on 6 May 2010 to elect members of Sunderland Metropolitan Borough Council in Tyne and Wear, England. One third of the council was up for election and the Labour Party stayed in overall control of the council. The election took place on the same day as the 2010 General Election.
The 2012 Sefton Metropolitan Borough Council election took on 3 May 2012 to elect members of Sefton Metropolitan Borough Council in England, as part of the 2012 United Kingdom local elections. 22 seats, representing one third of the total Council membership, were up for election in single-member wards. Ten - nearly half - of the members elected were newcomers to the Council; five of these defeated sitting Councillors seeking re-election, whilst in the other five wards, the incumbent retired. Two incumbents stood under different labels to those they were elected under in 2008; both were defeated in their wards.
The 2012 Plymouth City Council election took place on 3 May 2012 to elect members of Plymouth City Council in England. This was on the same day as other local elections. The election was won by the Labour Party, who gained control of the council from the Conservative Party.
Elections to North Tyneside Metropolitan Council took place on 22 May 2014. They coincided with other local elections happening in the UK that day, as well as the 2014 election to the European Parliament.
The 2022 United Kingdom local elections took place on Thursday 5 May 2022. These included elections for all London borough councils, for all local authorities in Wales and Scotland. Most seats in England were last up for election in 2018 and in Scotland and Wales in 2017. The elections coincided with the 2022 Northern Ireland Assembly election. In 91 cases, most of them in Wales, council seats were uncontested, each having only one candidate. Three seats in Scotland remained unfilled as no one nominated to fill them.
The 2022 Bury Metropolitan Borough Council election took place on 5 May 2022. Due to boundary changes, all 51 councillors were elected at the same time. The election took place alongside other local elections across the United Kingdom.
The 2022 Dudley Metropolitan Borough Council election took place on 5 May 2022. One third of councillors—24 out of 72—on Dudley Metropolitan Borough Council were elected, with 1 ward electing 2 councillors. The election took place alongside other local elections across the United Kingdom.
The 2022 Kirklees Metropolitan Borough Council election took place on 5 May 2022. One third of councillors—23 out of 69—on Kirklees Metropolitan Borough Council were elected. The election took place alongside other local elections across the United Kingdom.
The 2022 North Tyneside Metropolitan Borough Council election took place on 5 May 2022. One third of councillors—20 out of 60—on North Tyneside Metropolitan Borough Council were elected. The election took place alongside other local elections across the United Kingdom.
The 2023 North Tyneside Metropolitan Borough Council elections were held on 4 May 2023 alongside other local elections in the United Kingdom. One third of the seats on the council were contested at this election. Labour retained its majority on the council.
Preceded by 2009 North Tyneside Council mayoral election | North Tyneside local elections | Succeeded by 2011 North Tyneside Council election |