| |||||||||||||||||||||||||||||||||||||||||||||||||
| |||||||||||||||||||||||||||||||||||||||||||||||||
22 of 63 seats to Trafford Metropolitan Borough Council 32 seats needed for a majority | |||||||||||||||||||||||||||||||||||||||||||||||||
---|---|---|---|---|---|---|---|---|---|---|---|---|---|---|---|---|---|---|---|---|---|---|---|---|---|---|---|---|---|---|---|---|---|---|---|---|---|---|---|---|---|---|---|---|---|---|---|---|---|
| |||||||||||||||||||||||||||||||||||||||||||||||||
Map of results of 2010 election | |||||||||||||||||||||||||||||||||||||||||||||||||
|
Elections to Trafford Council were held on 6 May 2010. One-third of the council was up for election, with each successful candidate to serve a four-year term of office, expiring in 2014. The Conservative Party held overall control of the council.
Party | Votes | Seats | Full Council | |||||||
Conservative Party | 46,332 (40.3%) | 7.0 | 12 (54.5%) | 12 / 22 | 2 | 37 (58.7%) | 37 / 63 | |||
Labour Party | 36,382 (31.7%) | 4.1 | 8 (36.4%) | 8 / 22 | 2 | 21 (33.3%) | 21 / 63 | |||
Liberal Democrats | 26,136 (22.8%) | 5.9 | 2 (9.1%) | 2 / 22 | 5 (7.9%) | 5 / 63 | ||||
Green Party | 5,395 (4.7%) | 2.7 | 0 (0.0%) | 0 / 22 | 0 (0.0%) | 0 / 63 | ||||
UKIP | 476 (0.4%) | 0 (0.0%) | 0 / 22 | 0 (0.0%) | 0 / 63 | |||||
English Democrats | 168 (0.1%) | N/A | 0 (0.0%) | 0 / 22 | N/A | 0 (0.0%) | 0 / 63 |
21 | 5 | 37 |
Party | Candidate | Votes | % | ±% | |
---|---|---|---|---|---|
Conservative | Michael Young* | 2,366 | 44.0 | -9.6 | |
Labour | Peter Baugh | 1,404 | 26.1 | +3.2 | |
Liberal Democrats | Roger Legge | 1,250 | 23.2 | +8.1 | |
Green | Deborah Leftwich | 190 | 3.5 | -4.9 | |
English Democrat | Steve Mills | 168 | 3.1 | N/A | |
Majority | 962 | 17.9 | -12.8 | ||
Turnout | 5378 | 64.5 | +28.8 | ||
Conservative hold | Swing | ||||
Party | Candidate | Votes | % | ±% | |
---|---|---|---|---|---|
Conservative | John Lamb* | 2,325 | 44.5 | -13.9 | |
Labour | Michael Wilton | 1,568 | 30.0 | +4.1 | |
Liberal Democrats | Terry Corbett | 1,107 | 21.2 | N/A | |
Green | Sara Ahsan | 224 | 4.3 | -11.4 | |
Majority | 757 | 14.5 | -18.0 | ||
Turnout | 5224 | 71.5 | +32.1 | ||
Conservative hold | Swing | ||||
Party | Candidate | Votes | % | ±% | |
---|---|---|---|---|---|
Conservative | Karen Barclay | 3,304 | 34.2 | -4.5 | |
Conservative | Michael Hyman | 3,000 | 31.1 | ||
Liberal Democrats | Stuart Carter | 924 | 9.6 | +3.7 | |
Liberal Democrats | James Eisen | 682 | 7.1 | ||
Labour | Thomas Hague | 592 | 6.1 | +1.9 | |
Labour | Graham Crean | 566 | 5.9 | ||
Green | Bridget Green | 329 | 3.4 | -1.1 | |
Green | Rosemary Graham | 261 | 2.7 | ||
Majority | 2,076 | 43.0 | -13.9 | ||
Turnout | 9,658 | 70.4 | +28.7 | ||
Conservative hold | Swing | ||||
Party | Candidate | Votes | % | ±% | |
---|---|---|---|---|---|
Conservative | Jacki Wilkinson | 2,569 | 41.9 | -7.7 | |
Labour | Andrew Western | 1,799 | 29.3 | +3.5 | |
Liberal Democrats | Richard Wilson | 1,519 | 24.8 | +9.6 | |
Green | Christine McLaughlin | 247 | 4.0 | -5.4 | |
Majority | 770 | 12.6 | -11.2 | ||
Turnout | 6,134 | 66.2 | +30.4 | ||
Conservative hold | Swing | ||||
Party | Candidate | Votes | % | ±% | |
---|---|---|---|---|---|
Conservative | Pam Dixon* | 2,648 | 46.8 | -12.7 | |
Labour | Angela Gratrix | 1,444 | 25.5 | +8.7 | |
Liberal Democrats | John O'Connor | 1,389 | 24.5 | +0.7 | |
Green | Joseph Ryan | 179 | 3.2 | N/A | |
Majority | 1,204 | 21.3 | -14.4 | ||
Turnout | 5,660 | 71.0 | +32.1 | ||
Conservative hold | Swing | ||||
Party | Candidate | Votes | % | ±% | |
---|---|---|---|---|---|
Labour | David Quayle* | 1,972 | 51.2 | -2.3 | |
Conservative | Lisa Cooke | 1,025 | 26.6 | -4.4 | |
Liberal Democrats | Graham Rogers | 743 | 19.3 | N/A | |
Green | Daniel Wadsworth | 115 | 3.0 | -12.5 | |
Majority | 947 | 24.6 | +2.1 | ||
Turnout | 3,855 | 53.5 | +25.5 | ||
Labour hold | Swing | ||||
Party | Candidate | Votes | % | ±% | |
---|---|---|---|---|---|
Labour | Sophie Taylor* | 3,192 | 66.9 | +2.9 | |
Liberal Democrats | Simon Wright | 840 | 17.6 | N/A | |
Conservative | Lee Peck | 395 | 8.3 | -8.4 | |
Green | Anne Power | 343 | 7.2 | -12.0 | |
Majority | 2,352 | 49.3 | +4.5 | ||
Turnout | 4,770 | 62.4 | +30.5 | ||
Labour hold | Swing | ||||
.
Party | Candidate | Votes | % | ±% | |
---|---|---|---|---|---|
Conservative | Mike Cornes* | 2,232 | 43.3 | -19.8 | |
Labour | Helen Simpson | 1,969 | 38.2 | +1.3 | |
Liberal Democrats | Pauline Cliff | 801 | 15.5 | N/A | |
Green | Jennie Wadsworth | 157 | 3.0 | N/A | |
Majority | 263 | 5.1 | -21.1 | ||
Turnout | 5,159 | 66.5 | +30.0 | ||
Conservative hold | Swing | ||||
Party | Candidate | Votes | % | ±% | |
---|---|---|---|---|---|
Conservative | June Reilly* | 2,678 | 55.0 | -6.4 | |
Liberal Democrats | Elizabeth Hogg | 1,648 | 33.9 | N/A | |
Green | Joe Westbrook | 541 | 11.1 | +0.8 | |
Majority | 1,030 | 21.2 | -11.9 | ||
Turnout | 4,867 | 64.7 | +26.0 | ||
Conservative hold | Swing | ||||
Party | Candidate | Votes | % | ±% | |
---|---|---|---|---|---|
Conservative | Viv Ward* | 2,541 | 43.2 | -10.2 | |
Labour | Tom McDonald | 2,214 | 37.6 | +4.2 | |
Liberal Democrats | Richard Elliott | 915 | 15.5 | N/A | |
Green | Paul Syrett | 218 | 3.7 | -9.5 | |
Majority | 327 | 5.6 | -14.4 | ||
Turnout | 5,888 | 70.8 | +32.4 | ||
Conservative hold | Swing | ||||
Party | Candidate | Votes | % | ±% | |
---|---|---|---|---|---|
Labour | David Acton* | 2,721 | 58.6 | +3.1 | |
Conservative | Colin Levenston | 913 | 19.6 | -5.2 | |
Liberal Democrats | Frank Beswick | 801 | 17.2 | N/A | |
Green | Philip Leape | 212 | 4.6 | -7.3 | |
Majority | 1,808 | 38.9 | +8.2 | ||
Turnout | 4,647 | 58.2 | +30.9 | ||
Labour hold | Swing | ||||
Party | Candidate | Votes | % | ±% | |
---|---|---|---|---|---|
Conservative | Dylan Butt* | 3,279 | 61.5 | -9.6 | |
Liberal Democrats | Sandra Taylor | 1,240 | 23.3 | +4.7 | |
Labour | Joyce Acton | 663 | 12.4 | +2.0 | |
Green | Sarah McIlroy | 150 | 2.8 | N/A | |
Majority | 2,039 | 38.2 | -14.3 | ||
Turnout | 5,332 | 69.7 | +30.5 | ||
Conservative hold | Swing | ||||
Party | Candidate | Votes | % | ±% | |
---|---|---|---|---|---|
Conservative | Alan Mitchell* | 2,961 | 54.9 | -6.1 | |
Liberal Democrats | Julian Newgrosh | 1,191 | 22.1 | +6.6 | |
Labour | Gwyneth Brock | 915 | 17.0 | +4.5 | |
Green | Sam Little | 328 | 6.1 | -4.9 | |
Majority | 1,770 | 32.8 | -12.7 | ||
Turnout | 5,395 | 71.8 | +33.2 | ||
Conservative hold | Swing | ||||
Party | Candidate | Votes | % | ±% | |
---|---|---|---|---|---|
Labour | David Jarman* | 2,908 | 53.5 | +5.5 | |
Conservative | Paul Lally | 1,181 | 21.7 | -10.5 | |
Liberal Democrats | David Rhodes | 881 | 16.2 | N/A | |
Green | Margaret Westbrook | 463 | 8.5 | -5.8 | |
Majority | 1,727 | 31.8 | +16.0 | ||
Turnout | 5,433 | 62.5 | +28.9 | ||
Labour hold | Swing | ||||
Party | Candidate | Votes | % | ±% | |
---|---|---|---|---|---|
Labour | Jane Baugh* | 2,087 | 39.3 | +0.1 | |
Conservative | James Callaghan | 1,618 | 30.5 | -2.7 | |
Liberal Democrats | Will Jones | 1,345 | 25.3 | +7.5 | |
Green | Emma Handley | 263 | 5.0 | -4.8 | |
Majority | 469 | 8.8 | -2.8 | ||
Turnout | 5,313 | 66.7 | +27.4 | ||
Labour hold | Swing | ||||
Party | Candidate | Votes | % | ±% | |
---|---|---|---|---|---|
Labour | Philip Gratrix | 2,032 | 40.9 | +1.8 | |
Conservative | Christine Bailey* | 1,668 | 33.6 | -6.4 | |
Liberal Democrats | Derek Hurst | 1,068 | 21.5 | +0.6 | |
Green | Bridget Battye | 198 | 4.0 | N/A | |
Majority | 364 | 7.3 | |||
Turnout | 4,966 | 65.2 | +28.6 | ||
Labour gain from Conservative | Swing | ||||
Party | Candidate | Votes | % | ±% | |
---|---|---|---|---|---|
Conservative | Rob Chilton | 2,367 | 43.3 | -8.9 | |
Labour | Thomas Tomkins | 1,619 | 29.6 | +1.6 | |
Liberal Democrats | Marjorie Rhodes | 1,089 | 19.9 | -1.0 | |
UKIP | Stephen Farndon | 223 | 4.1 | N/A | |
Green | Zoe Power | 165 | 3.0 | -3.7 | |
Majority | 748 | 13.7 | -10.5 | ||
Turnout | 5,463 | 62.8 | +26.0 | ||
Conservative hold | Swing | ||||
Party | Candidate | Votes | % | ±% | |
---|---|---|---|---|---|
Labour | Dolores O'Sullivan | 2,585 | 53.0 | +3.3 | |
Conservative | Benita Dirikis | 1,192 | 24.4 | -9.6 | |
Liberal Democrats | Kenneth Clarke | 845 | 17.3 | N/A | |
Green | Liz O'Neill | 255 | 5.2 | -11.1 | |
Majority | 1,393 | 28.6 | +12.9 | ||
Turnout | 4,877 | 62.0 | +25.0 | ||
Labour hold | Swing | ||||
Party | Candidate | Votes | % | ±% | |
---|---|---|---|---|---|
Liberal Democrats | Neil Taylor* | 2,638 | 42.0 | -1.6 | |
Conservative | Angela Bruer-Morris | 2,384 | 37.9 | -3.0 | |
Labour | Margaret Westhead | 863 | 13.7 | +3.2 | |
UKIP | Ken Bullman | 253 | 4.0 | N/A | |
Green | Jadwiga Leigh | 144 | 2.3 | -2.7 | |
Majority | 254 | 4.0 | -1.3 | ||
Turnout | 6,282 | 74.8 | +30.0 | ||
Liberal Democrats hold | Swing | ||||
Party | Candidate | Votes | % | ±% | |
---|---|---|---|---|---|
Labour | Kevin Procter | 2,292 | 42.4 | +2.4 | |
Conservative | James Wibberley* | 2,042 | 37.8 | -8.6 | |
Liberal Democrats | Louise Bird | 821 | 15.2 | N/A | |
Green | Helen Jocys | 252 | 4.7 | -8.9 | |
Majority | 250 | 4.6 | |||
Turnout | 5,407 | 67.5 | +25.1 | ||
Labour gain from Conservative | Swing | ||||
Party | Candidate | Votes | % | ±% | |
---|---|---|---|---|---|
Liberal Democrats | Tony Fishwick* | 2,399 | 46.3 | -3.0 | |
Conservative | Richard Peers | 1,644 | 31.7 | -2.4 | |
Labour | Thom Shelton | 977 | 18.9 | +7.3 | |
Green | Michael Leigh | 161 | 3.1 | -1.9 | |
Majority | 755 | 14.6 | -0.6 | ||
Turnout | 5,181 | 66.3 | +28.1 | ||
Liberal Democrats hold | Swing | ||||
Trafford Metropolitan Borough Council elections are generally held three years out of every four, with a third of the council being elected each time. Trafford Metropolitan Borough Council, generally known as Trafford Council, is the local authority for the metropolitan borough of Trafford in Greater Manchester, England. Since the last boundary changes in 2023, 63 councillors have been elected from 21 wards.
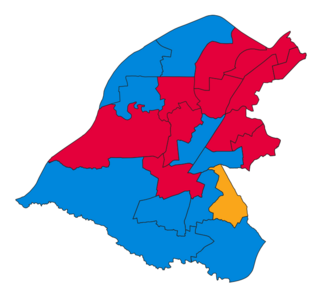
On 6 May 1999, an election was held to choose council members for the Trafford Borough Council in Greater Manchester, England. One-third of the council members were up for election, with each successful candidate to serve a four-year term of office, expiring in 2003. The Labour Party held overall control of the council.
Elections to Trafford Council were held on 2 May 2002. One third of the council was up for election, with each successful candidate to serve a two-year term of office, expiring in 2004, due to the boundary changes and 'all-out' elections due to take place that year. The Labour Party retained overall control of the council. Overall turnout was 52.3%.
Elections to Trafford Council were held on 4 May 2006. One third of the council was up for election, with each successful candidate to serve a four-year term of office, expiring in 2010. The Conservative Party retained overall control of the council.
Elections to Trafford Council were held on 3 May 2007. One third of the council was up for election, with each successful candidate to serve a four-year term of office, expiring in 2011. The Conservative Party retained overall control of the council.
Elections to Trafford Council were held on 1 May 2008. One-third of the council was up for election, with each successful candidate to serve a four-year term of office, expiring in 2012. The Conservative Party held overall control of the council.
Elections to Trafford Council were held on 7 May 1992. One-third of the council was up for election, with each successful candidate to serve a four-year term of office, expiring in 1996. The Conservative party retained overall control of the council.
Elections to Trafford Council were held on 2 May 1991. One-third of the council was up for election, with each successful candidate to serve a four-year term of office, expiring in 1995. The Conservative party retained overall control of the council.
Elections to Trafford Council were held on 4 May 1990. One-third of the council was up for election, with each successful candidate to serve a four-year term of office, expiring in 1994. The Conservative party retained overall control of the council.
Elections to Trafford Council in the United Kingdom were held on 5 May 1988. One-third of the council was up for election, with each successful candidate to serve a four-year term of office, expiring in 1992. The Conservative party gained overall control of the council, from no overall control.
Elections to Trafford Council were held on 7 May 1987. One third of the council was up for election, with each successful candidate to serve a four-year term of office, expiring in 1991. The council remained under no overall control.
Elections to Trafford Council were held on Thursday, 6 May 1982. One third of the council was up for election, with each successful candidate to serve a four-year term of office, expiring in 1986. The Conservative Party retained overall control of the council.
Elections to Trafford Council were held on Thursday, 3 May 1979, on the same day as the 1979 UK General Election. One third of the council was up for election, with each successful candidate to serve a four-year term of office, expiring in 1983. The Conservative Party retained overall control of the council.
Elections to Trafford Council were held on Thursday, 4 May 1978. One third of the council was up for election, with each successful candidate to serve a four-year term of office, expiring in 1982. The Conservative Party retained overall control of the council.
Elections to Trafford Council were held on Thursday, 6 May 1976. One third of the council was up for election, with each successful candidate to serve a four-year term of office, expiring in 1980. The Conservative Party retained overall control of the council.
Elections to Trafford Council were held on Thursday, 1 May 1975. One third of the council was up for election, with each successful candidate to serve a four-year term of office, expiring in 1979. These were the first Borough elections to be held in Trafford since it received its Royal Charter in 1974. The Conservative Party retained overall control of the council.
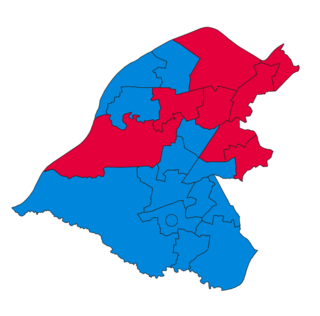
Elections to the Council of the metropolitan borough of Trafford, Greater Manchester, England were held on 5 May 2011. One third of the council was up for election, with each successful candidate serving a four-year term of office, expiring in 2015. The Conservative Party retained overall control of the council.
Elections to Trafford Council were held on 3 May 2012. One third of the council was up for election, with each successful candidate serving a four-year term of office, expiring in 2016. The Conservative Party held overall control of the council.
The 2015 Trafford Metropolitan Borough Council election was scheduled to take place on 7 May 2015 to elect members of Trafford Metropolitan Borough Council in England. This was on the same day as other local elections. One third of the council was up for election, with each successful candidate serving a four-year term of office, expiring in 2019. The Conservative Party held overall control of the council.
The 2018 Trafford Metropolitan Borough Council election to elect members of Trafford Metropolitan Borough Council in England took place on 3 May 2018. This was on the same day as other local elections.