![]() | This article has multiple issues. Please help improve it or discuss these issues on the talk page . (Learn how and when to remove these messages)
|
![]() | |||||||||||||||||||||||||||||||||||||||||||||||||||||
| |||||||||||||||||||||||||||||||||||||||||||||||||||||
21 of 63 seats to Trafford Metropolitan Borough Council 32 seats needed for a majority | |||||||||||||||||||||||||||||||||||||||||||||||||||||
---|---|---|---|---|---|---|---|---|---|---|---|---|---|---|---|---|---|---|---|---|---|---|---|---|---|---|---|---|---|---|---|---|---|---|---|---|---|---|---|---|---|---|---|---|---|---|---|---|---|---|---|---|---|
| |||||||||||||||||||||||||||||||||||||||||||||||||||||
![]() Map of results of 2002 election | |||||||||||||||||||||||||||||||||||||||||||||||||||||
|
Elections to Trafford Council were held on 2 May 2002. One third of the council was up for election, with each successful candidate to serve a two-year term of office, expiring in 2004, due to the boundary changes and 'all-out' elections due to take place that year. The Labour Party retained overall control of the council. Overall turnout was 52.3%.
Trafford Council Election 2002 [1] [2] | ||||||||||
Party | Votes | Seats | Full Council | |||||||
Labour Party | 34,670 (41.2%) | ![]() | 11 (52.4%) | 11 / 21 | ![]() | 32 (50.8%) | 32 / 63 | |||
Conservative Party | 37,938 (45.1%) | ![]() | 9 (42.9%) | 9 / 21 | ![]() | 28 (44.4%) | 28 / 63 | |||
Liberal Democrats | 10,071 (12.0%) | ![]() | 1 (4.8%) | 1 / 21 | ![]() | 3 (4.8%) | 3 / 63 | |||
Green Party | 653 (0.8%) | N/A | 0 (0.0%) | 0 / 21 | N/A | 0 (0.0%) | 0 / 63 | |||
Independent | 636 (0.8%) | ![]() | 0 (0.0%) | 0 / 21 | ![]() | 0 (0.0%) | 0 / 63 | |||
Socialist Labour Party | 189 (0.2%) | N/A | 0 (0.0%) | 0 / 21 | N/A | 1 (0.0%) | 0 / 63 |
32 | 3 | 28 |
Party | Candidate | Votes | % | ±% | |
---|---|---|---|---|---|
Conservative | Susan Fildes* | 2,503 | 54.5 | −4.6 | |
Labour | Peter Baugh | 1,472 | 32.0 | +4.9 | |
Liberal Democrats | Christopher Gaskell | 621 | 13.5 | +6.7 | |
Majority | 1,031 | 22.5 | −9.5 | ||
Turnout | 4,596 | 52.8 | +20.4 | ||
Conservative hold | Swing |
Party | Candidate | Votes | % | ±% | |
---|---|---|---|---|---|
Conservative | Marie Harney* | 3,345 | 63.9 | −9.1 | |
Labour | Helen Walsh | 771 | 14.7 | +2.4 | |
Liberal Democrats | Roger Legge | 762 | 14.6 | +0.0 | |
Green | Bridget Green | 359 | 6.9 | +6.9 | |
Majority | 2,574 | 49.2 | −9.2 | ||
Turnout | 5,237 | 56.7 | +24.2 | ||
Conservative hold | Swing |
Party | Candidate | Votes | % | ±% | |
---|---|---|---|---|---|
Labour | Jane Baugh* | 2,454 | 49.9 | +6.0 | |
Conservative | Alexander Williams | 2,060 | 41.9 | −6.7 | |
Independent | Guy Morgan | 404 | 8.2 | +8.2 | |
Majority | 394 | 8.0 | |||
Turnout | 4,918 | 57.3 | +19.8 | ||
Labour hold | Swing |
Party | Candidate | Votes | % | ±% | |
---|---|---|---|---|---|
Conservative | David Higgins* | 2,378 | 56.6 | −9.7 | |
Labour | Philip Morgan | 1,086 | 25.9 | +5.3 | |
Liberal Democrats | Kenneth Clarke | 737 | 17.5 | +4.4 | |
Majority | 1,292 | 30.7 | −15.0 | ||
Turnout | 4,201 | 54.3 | +16.4 | ||
Conservative hold | Swing |
Party | Candidate | Votes | % | ±% | |
---|---|---|---|---|---|
Labour | Graham Kanes* | 1,759 | 75.3 | +2.6 | |
Conservative | James Davies | 576 | 24.7 | −2.6 | |
Majority | 1,183 | 50.6 | +5.2 | ||
Turnout | 2,335 | 41.0 | +22.4 | ||
Labour hold | Swing |
Party | Candidate | Votes | % | ±% | |
---|---|---|---|---|---|
Labour | Peter Mitchell* | 2,256 | 75.8 | −0.1 | |
Conservative | Alexander Kelly | 428 | 14.4 | −3.2 | |
Green | Anne Power | 294 | 9.9 | +9.9 | |
Majority | 1,828 | 61.4 | +3.1 | ||
Turnout | 2,978 | 40.0 | +17.6 | ||
Labour hold | Swing |
Party | Candidate | Votes | % | ±% | |
---|---|---|---|---|---|
Conservative | Edith Eadie* | 2,126 | 57.4 | −9.7 | |
Labour | Nigel Roberts | 1,581 | 42.7 | +9.7 | |
Majority | 545 | 14.7 | −19.4 | ||
Turnout | 3,707 | 52.2 | +19.7 | ||
Conservative hold | Swing |
Party | Candidate | Votes | % | ±% | |
---|---|---|---|---|---|
Conservative | June Reilly | 2,189 | 51.7 | −11.3 | |
Labour | Freda Mottley* | 2,049 | 48.4 | +11.4 | |
Majority | 140 | 3.3 | −22.7 | ||
Turnout | 4,238 | 56.6 | +16.4 | ||
Conservative gain from Labour | Swing |
Party | Candidate | Votes | % | ±% | |
---|---|---|---|---|---|
Conservative | Keith Summerfield | 2,070 | 51.5 | −9.0 | |
Labour | Karina Carter | 1,946 | 48.5 | +8.9 | |
Majority | 124 | 3.0 | −17.9 | ||
Turnout | 4,016 | 53.8 | +15.8 | ||
Conservative hold | Swing |
Party | Candidate | Votes | % | ±% | |
---|---|---|---|---|---|
Conservative | Ian Mullins | 3,333 | 69.1 | −6.0 | |
Labour | Beverly Harrison | 828 | 17.2 | +4.8 | |
Liberal Democrats | Richard Elliott | 664 | 13.8 | +1.3 | |
Majority | 2,505 | 51.9 | −10.7 | ||
Turnout | 4,825 | 58.0 | +24.2 | ||
Conservative hold | Swing |
Party | Candidate | Votes | % | ±% | |
---|---|---|---|---|---|
Labour | Judith Lloyd* | 2,174 | 62.3 | +7.8 | |
Conservative | John Schofield | 1,318 | 37.7 | −7.8 | |
Majority | 856 | 24.6 | +15.6 | ||
Turnout | 3,492 | 48.5 | +13.9 | ||
Labour hold | Swing |
Party | Candidate | Votes | % | ±% | |
---|---|---|---|---|---|
Conservative | Brian Rigby* | 2,914 | 55.8 | −9.0 | |
Labour | Sophie Taylor | 1,621 | 31.0 | +8.2 | |
Liberal Democrats | Graham Rogers | 687 | 13.2 | +0.7 | |
Majority | 1,293 | 24.8 | −17.2 | ||
Turnout | 5,222 | 54.6 | +22.1 | ||
Conservative hold | Swing |
Party | Candidate | Votes | % | ±% | |
---|---|---|---|---|---|
Labour | Ian McDermott | 1,750 | 62.8 | +7.4 | |
Conservative | Pervez Nakvi | 1,038 | 37.2 | −7.4 | |
Majority | 712 | 25.6 | +14.8 | ||
Turnout | 2,788 | 46.8 | +22.0 | ||
Labour hold | Swing |
Party | Candidate | Votes | % | ±% | |
---|---|---|---|---|---|
Labour | Barry Brotherton* | 1,909 | 48.5 | −0.5 | |
Conservative | Joseph Garner | 1,183 | 30.0 | −3.9 | |
Liberal Democrats | Michael Riley | 846 | 21.5 | +4.4 | |
Majority | 726 | 18.5 | +3.4 | ||
Turnout | 3,938 | 51.3 | +10.4 | ||
Labour hold | Swing |
Party | Candidate | Votes | % | ±% | |
---|---|---|---|---|---|
Labour | Philip Gratrix* | 1,906 | 47.5 | +3.0 | |
Conservative | Christopher Lynch | 1,311 | 32.7 | −11.0 | |
Liberal Democrats | Derek Hurst | 564 | 14.1 | +2.3 | |
Independent | Majorie Hepburn | 232 | 5.8 | +5.8 | |
Majority | 595 | 14.8 | +14.0 | ||
Turnout | 4,013 | 53.2 | +19.6 | ||
Labour hold | Swing |
Party | Candidate | Votes | % | ±% | |
---|---|---|---|---|---|
Labour | Leonard Murkin* | 2,737 | 66.4 | +20.9 | |
Conservative | Dilraz Butt | 1,386 | 33.6 | −11.4 | |
Majority | 1,351 | 32.8 | +32.3 | ||
Turnout | 4,123 | 49.8 | +19.9 | ||
Labour hold | Swing |
Party | Candidate | Votes | % | ±% | |
---|---|---|---|---|---|
Labour | Stephen Adshead* | 2,224 | 58.3 | +1.4 | |
Conservative | John Lamb | 1,403 | 36.8 | −6.3 | |
Socialist Labour | Prudence Hibberd | 189 | 5.0 | +5.0 | |
Majority | 821 | 21.5 | +7.7 | ||
Turnout | 3,816 | 50.8 | +18.3 | ||
Labour hold | Swing |
Party | Candidate | Votes | % | ±% | |
---|---|---|---|---|---|
Labour | Simon Beaumont* | 1,824 | 77.2 | +10.6 | |
Conservative | George Manley | 538 | 22.8 | −2.8 | |
Majority | 1,286 | 54.4 | +13.4 | ||
Turnout | 2,362 | 37.9 | +16.4 | ||
Labour hold | Swing |
Party | Candidate | Votes | % | ±% | |
---|---|---|---|---|---|
Conservative | Anne Bowker* | 2,426 | 53.4 | −0.1 | |
Liberal Democrats | Catherine Smith | 2,120 | 46.6 | +18.6 | |
Majority | 306 | 6.8 | −18.7 | ||
Turnout | 4,546 | 52.4 | +18.4 | ||
Conservative hold | Swing |
Party | Candidate | Votes | % | ±% | |
---|---|---|---|---|---|
Labour | David Acton* | 2,323 | 56.8 | +2.9 | |
Conservative | Christine Turner | 1,765 | 43.2 | −3.0 | |
Majority | 558 | 13.6 | +5.9 | ||
Turnout | 4,088 | 54.0 | +12.7 | ||
Labour hold | Swing |
Party | Candidate | Votes | % | ±% | |
---|---|---|---|---|---|
Liberal Democrats | Douglas Fishwick | 3,070 | 65.1 | +9.8 | |
Conservative | Patricia Morris | 1,648 | 34.9 | +0.5 | |
Majority | 1,422 | 30.2 | +9.3 | ||
Turnout | 4,718 | 50.6 | +12.5 | ||
Liberal Democrats hold | Swing |
Party | Candidate | Votes | % | ±% | |
---|---|---|---|---|---|
Conservative | M. D. Cornes | 2,030 | 57.6 | +0.2 | |
Labour | N. K. Roberts | 1,493 | 42.4 | −0.2 | |
Majority | 537 | 15.2 | +0.5 | ||
Turnout | 3,523 | 50.0 | −2.2 | ||
Conservative hold | Swing |
Trafford is a metropolitan borough of Greater Manchester, England, with an estimated population of 236,301 in 2022. It covers 106 square kilometres (41 sq mi) and includes the area of Old Trafford and the towns of Altrincham, Stretford, Urmston, Partington and Sale. The borough was formed in 1974 as a merger of six former districts and part of a seventh. The River Mersey flows through the borough, separating North Trafford from South Trafford, and the historic counties of Lancashire and Cheshire. Trafford is the seventh-most populous district in Greater Manchester.
Trafford Metropolitan Borough Council elections are generally held three years out of every four, with a third of the council being elected each time. Trafford Metropolitan Borough Council, generally known as Trafford Council, is the local authority for the metropolitan borough of Trafford in Greater Manchester, England. Since the last boundary changes in 2023, 63 councillors have been elected from 21 wards.
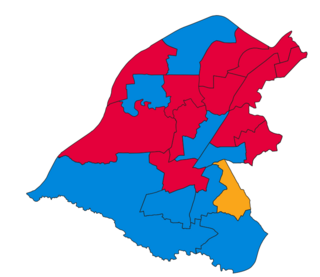
Elections to Trafford Council were held on 7 May 1998. One-third of the council was up for election, with each successful candidate to serve a four-year term of office, expiring in 2002. The Labour Party held overall control of the council.
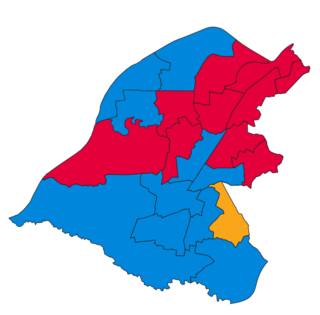
Elections to Trafford Council were held on 1 May 2003. One third of the council was up for election, with each successful candidate to serve a one-year term of office, expiring in 2004 due to the boundary changes and 'all-out' elections due to take place that year. The Labour Party lost overall control of the council, to no overall control. Overall turnout was 52.3%.
Elections to Trafford Metropolitan Borough Council were held on 10 June 2004.
Trafford Council, or Trafford Metropolitan Borough Council, is the local authority of the Metropolitan Borough of Trafford in Greater Manchester, England. It is a metropolitan borough council and provides the majority of local government services in the borough. The council has been a member of the Greater Manchester Combined Authority since 2011.
Hull City Council elections are held three years out of every four to elect members of Hull City Council, the unitary authority which governs the city of Kingston upon Hull in the East Riding of Yorkshire, England. Since the last boundary changes in 2018, the council has comprised 57 councillors representing 21 wards with each ward electing either 2 or 3 councillors.
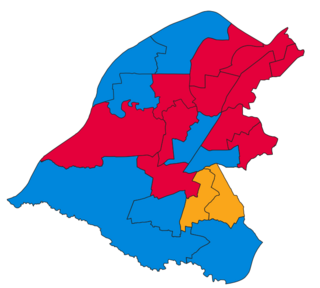
Elections to Trafford Council were held on 5 May 1994. One-third of the council was up for election, with each successful candidate to serve a four-year term of office, expiring in 1998. The Conservative party retained overall control of the council.
Elections to Trafford Council were held on 3 May 1984. One third of the council was up for election, with each successful candidate to serve a four-year term of office, expiring in 1988. The Conservative Party retained overall control of the council.
The first elections to Trafford Council were held on Thursday, 10 May 1973. This was a new council created to replace the following authorities: the Municipal Borough of Altrincham, the Municipal Borough of Sale, the Municipal Borough of Stretford, Bowdon Urban District, Hale Urban District, Urmston Urban District, and parts of Bucklow Rural District. This election would create the entire 63-member council, which would shadow its predecessor councils before taking over their functions on 1 April 1974, as specified in the Local Government Act 1972. Each 1st-placed candidate would serve a five-year term of office, expiring in 1978. Each 2nd-placed candidate would serve a three-year term of office, expiring in 1976. Each 3rd-placed candidate would serve a two-year term of office, expiring in 1975.
Priory is an electoral ward of Trafford, Greater Manchester, covering the northern and central part of Sale, including the Town Centre.
A Trafford Metropolitan Borough Council election took place on 22 May 2014 to elect members of Trafford Metropolitan Borough Council in England. This was on the same day as other local elections. One third of the council was up for election, with each successful candidate serving a four-year term of office, expiring in 2018. The Conservative Party held overall control of the council.
The 2015 United Kingdom local elections were held on Thursday 7 May 2015, the same day as the general election for the House of Commons.
The 2018 Trafford Metropolitan Borough Council election to elect members of Trafford Metropolitan Borough Council in England took place on 3 May 2018. This was on the same day as other local elections.
The 2019 Trafford Metropolitan Borough Council election to elect members of Trafford Metropolitan Borough Council in England took place on 2 May 2019. This was on the same day as other local elections.
Andrew Howard Western is a British politician serving as Member of Parliament (MP) for Stretford and Urmston since 2022. A member of the Labour Party, he has been Parliamentary Under-Secretary of State for Transformation in the Department for Work and Pensions since 2024. Prior to his election to Parliament, Western served as Leader of Trafford Council from 2018 to 2022.
The 2021 Trafford Metropolitan Borough Council election to elect members of Trafford Metropolitan Borough Council in England took place on 6 May 2021. As with many other local elections in England, it was postponed from May 2020, due to the COVID-19 pandemic.
The 2022 Trafford Metropolitan Borough Council election to elect members of Trafford Metropolitan Borough Council in England took place on 5 May 2022. One third of the 63 seats were contested, with one additional seat also contested in Gorse Hill as a by-election owing to a councillor retiring mid-term. Each successful candidate will serve a one-year term of office rather than the normal four-year term due to a boundary review to be implemented in 2023.
The 2023 Trafford Metropolitan Borough Council elections took place on 4 May 2023 alongside other elections in the United Kingdom. Due to boundary changes, all 63 seats were contested.