Borough result maps
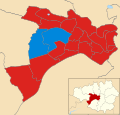 2016 results map
 2018 results map
 2019 results map
 2021 results map
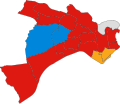 2022 results map
 2023 results map
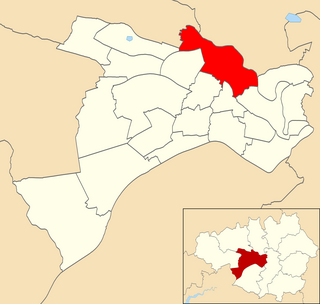
 2024 results map
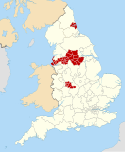
Salford City Council elections are generally held three years out of every four, with a third of the council being elected each time. Salford City Council is the local authority for the metropolitan borough of Salford in Greater Manchester, England. Since the last boundary changes in 2020, 60 councillors have been elected from 20 wards. [1]
Since 1973 political control of the council has been held by the Labour Party. [2] [3] [4]
| Year | Labour | Conservative | Lib Dems | Independent | Community Action | |||||
|---|---|---|---|---|---|---|---|---|---|---|
| 2024 | 50 | 7 | 2 | 1 | 0 | |||||
| 2023 | 49 | 8 | 2 | 1 | 0 | |||||
| 2022 | 49 | 8 | 2 | 1 | 0 | |||||
| 2021 | 52 | 7 | 1 | 0 | 0 | |||||
| 2019 | 51 | 8 | 0 | 1 | 0 | |||||
| 2018 | 50 | 9 | 0 | 1 | 0 | |||||
| 2016 | 50 | 9 | 0 | 1 | 0 | |||||
| 2015 | 52 | 8 | 0 | 0 | 0 | |||||
| 2014 | 52 | 8 | 0 | 0 | 0 | |||||
| 2012 | 52 | 8 | 0 | 0 | 0 | |||||
| 2011 | 44 | 11 | 3 | 2 | 0 | |||||
| 2010 | 39 | 13 | 5 | 1 | 2 | |||||
| 2008 | 36 | 13 | 10 | 0 | 1 | |||||
| 2007 | 44 | 8 | 8 | 0 | 0 | |||||
| 2006 | 44 | 8 | 8 | 0 | 0 | |||||
| 2004 | 44 | 8 | 8 | 0 | 0 | |||||
| 2003 | 51 | 3 | 5 | 1 | 0 | |||||
| 2002 | 52 | 2 | 6 | 0 | 0 | |||||
| 2000 | 52 | 3 | 5 | 0 | 0 | |||||
| 1999 | 56 | 0 | 4 | 0 | 0 | |||||
| 1998 | 57 | 0 | 3 | 0 | 0 | |||||
| 1997 | 57 | 0 | 3 | 0 | 0 | |||||
| 1996 | 57 | 0 | 3 | 0 | 0 | |||||
| 1995 | 55 | 3 | 2 | 0 | 0 | |||||
| 1994 | 54 | 5 | 1 | 0 | 0 | |||||
| 1993 | 54 | 6 | 0 | 0 | 0 | |||||
| 1992 | 54 | 6 | 0 | 0 | 0 | |||||
| 1991 | 56 | 4 | 0 | 0 | 0 | |||||
| 1990 | 55 | 5 | 0 | 0 | 0 | |||||


| Party | Candidate | Votes | % | ±% | |
|---|---|---|---|---|---|
| Labour | 2,654 | 62.3 | −21.1 | ||
| Conservative | 1,141 | 26.8 | +26.8 | ||
| Liberal Democrats | 466 | 10.9 | −5.7 | ||
| Majority | 1,512 | 35.5 | |||
| Turnout | 4,261 | ||||
| Labour hold | Swing | ||||
| Party | Candidate | Votes | % | ±% | |
|---|---|---|---|---|---|
| Labour | 3,963 | 68.3 | −7.4 | ||
| Conservative | 1,034 | 17.8 | −4.7 | ||
| Liberal Democrats | 807 | 13.9 | +2.6 | ||
| Majority | 2,929 | 50.5 | |||
| Turnout | 5,804 | ||||
| Labour hold | Swing | ||||
| Party | Candidate | Votes | % | ±% | |
|---|---|---|---|---|---|
| Labour | 705 | 78.6 | −4.1 | ||
| Liberal Democrats | 108 | 12.0 | +4.8 | ||
| Conservative | 84 | 9.4 | −0.7 | ||
| Majority | 597 | 66.6 | |||
| Turnout | 897 | 10.5 | |||
| Labour hold | Swing | ||||
| Party | Candidate | Votes | % | ±% | |
|---|---|---|---|---|---|
| Labour | Neville Clarke | 2,070 | 64.1 | +8.6 | |
| Liberal Democrats | Margaret Powis | 594 | 18.4 | −2.0 | |
| Conservative | Judith Tope | 564 | 17.5 | −6.6 | |
| Majority | 1,476 | 45.7 | |||
| Turnout | 3,228 | 42.8 | +24.4 | ||
| Labour hold | Swing | ||||
| Party | Candidate | Votes | % | ±% | |
|---|---|---|---|---|---|
| Labour | Susan Slater | 1,025 | 58.7 | −6.9 | |
| Liberal Democrats | Ann Gibbons | 587 | 33.6 | +8.6 | |
| Independent | Sheila Wallace | 81 | 4.6 | +4.6 | |
| Socialist Alliance | Gary Duke | 54 | 3.1 | +3.1 | |
| Majority | 438 | 25.1 | |||
| Turnout | 1,747 | ||||
| Labour hold | Swing | ||||
| Party | Candidate | Votes | % | ±% | |
|---|---|---|---|---|---|
| Labour | Jane Murphy | 842 | 40.4 | +1.3 | |
| Conservative | Michael Edwards | 677 | 32.5 | +3.6 | |
| Liberal Democrats | Deborah Rushton | 566 | 27.1 | −4.9 | |
| Majority | 165 | 7.9 | |||
| Turnout | 2,085 | 26.3 | −12.8 | ||
| Labour gain from Liberal Democrats | Swing | ||||
| Party | Candidate | Votes | % | ±% | |
|---|---|---|---|---|---|
| Labour | Gina Loveday | 720 | 55.4 | +13.2 | |
| Liberal Democrats | John Deas | 410 | 31.6 | +9.1 | |
| Conservative | Jeremiah Horgan | 169 | 13.0 | −2.8 | |
| Majority | 310 | 23.8 | |||
| Turnout | 1,303 | 14.8 | −16.0 | ||
| Labour hold | Swing | ||||
| Party | Candidate | Votes | % | ±% | |
|---|---|---|---|---|---|
| Labour | James Harold | 439 | 59.9 | +21.3 | |
| Liberal Democrats | Bernard Carson | 144 | 19.6 | −11.1 | |
| Conservative | Johnathan Thomason | 96 | 13.1 | −3.6 | |
| Green | Jadwiga Irksa | 32 | 4.4 | +4.4 | |
| Independent | Alan Valentine | 22 | 3.0 | −11.0 | |
| Majority | 295 | 40.3 | |||
| Turnout | 734 | 12.6 | −15.6 | ||
| Labour hold | Swing | ||||
| Party | Candidate | Votes | % | ±% | |
|---|---|---|---|---|---|
| Labour | Valerie Burgoyne | 643 | 34.9 | −2.2 | |
| Liberal Democrats | Joseph O'Neill | 579 | 31.5 | −0.8 | |
| Conservative | Christopher Davies | 543 | 29.5 | +0.0 | |
| Green | Ian Davies | 76 | 4.1 | +4.1 | |
| Majority | 64 | 3.4 | |||
| Turnout | 1,843 | 22.1 | −14.4 | ||
| Labour hold | Swing | ||||
| Party | Candidate | Votes | % | ±% | |
|---|---|---|---|---|---|
| Labour | Norbert Potter | 676 | 45.6 | +1.6 | |
| Liberal Democrats | Roy Laurence | 389 | 26.2 | −4.1 | |
| Conservative | Judith Tope | 189 | 12.7 | −13.0 | |
| UKIP | Bernard Gill | 137 | 9.2 | +9.2 | |
| Independent | Alan Valentine | 93 | 6.3 | +6.3 | |
| Majority | 287 | 19.4 | |||
| Turnout | 1,489 | 17.1 | −15.4 | ||
| Labour hold | Swing | ||||
| Party | Candidate | Votes | % | ±% | |
|---|---|---|---|---|---|
| Labour | John Ferguson | 1,055 | 38.2 | +1.3 | |
| Conservative | Jillian Collinson | 874 | 31.6 | +0.4 | |
| BNP | Eddy O'Sullivan | 373 | 13.5 | +0.2 | |
| Liberal Democrats | Paul Gregory | 368 | 13.3 | −0.9 | |
| Independent | Stuart Cremins | 49 | 1.8 | −2.6 | |
| Green | Diana Battersby | 43 | 1.6 | +1.6 | |
| Majority | 181 | 6.6 | |||
| Turnout | 2,762 | 30.7 | |||
| Labour hold | Swing | ||||
| Party | Candidate | Votes | % | ±% | |
|---|---|---|---|---|---|
| Labour | Matt Mold | 606 | 37.6 | −13.3 | |
| Liberal Democrats | Steven Middleton | 293 | 18.2 | −1.1 | |
| BNP | Gary Tumulty | 276 | 17.1 | +3.8 | |
| Conservative | Chris Bates | 189 | 11.7 | −4.7 | |
| Green | Rob Mitchell | 125 | 7.8 | +7.8 | |
| UKIP | Duran O'Dwyer | 123 | 7.6 | +7.6 | |
| Majority | 313 | 19.4 | |||
| Turnout | 1,612 | 17.6 | |||
| Labour hold | Swing | ||||
| Party | Candidate | Votes | % | ±% | |
|---|---|---|---|---|---|
| Labour | Brendan Patrick Ryan | 1,291 | |||
| Conservative | Chris Bates | 209 | |||
| English Democrat | Laurence Depares | 125 | |||
| BNP | Keith Fairhurst | 92 | |||
| Liberal Democrats | Susan Carson | 62 | |||
| Majority | 1,082 | ||||
| Turnout | 1,786 | 20.9 | |||
| Labour hold | Swing | ||||
| Party | Candidate | Votes | % | ±% | |
|---|---|---|---|---|---|
| Labour | Michael Wheeler | 1,227 | 54.46 | ||
| Conservative | Nicholas Johnson | 701 | 31.11 | ||
| BNP | Kay Pollitt | 147 | 6.52 | ||
| Liberal Democrats | Valerie Kelly | 125 | 5.54 | ||
| Independent | Alan Dominic Valentine | 53 | 2.35 | ||
| Majority | 526 | ||||
| Turnout | 2,253 | 25.15 | |||
| Party | Candidate | Votes | % | ±% | |
|---|---|---|---|---|---|
| Labour | Paul Wilson | 785 | 44.4 | −10.3 | |
| UKIP | Glyn Wright | 401 | 22.7 | +22.7 | |
| Conservative | Adam Kennaugh | 260 | 14.7 | +2.0 | |
| Green | Mary Ferrer | 80 | 4.5 | +4.5 | |
| BNP | Kay Pollitt | 74 | 4.2 | −4.5 | |
| Independent | Matt Simpson | 64 | 3.6 | +3.6 | |
| Liberal Democrats | Valerie Kelly | 58 | 3.3 | −15.4 | |
| TUSC | Terry Simmons | 30 | 1.7 | +1.7 | |
| Independent | Alan Valentine | 15 | 0.8 | +0.8 | |
| Majority | 384 | ||||
| Turnout | 1778 | 19.9 | |||
| Labour hold | Swing | ||||
Election followed the death of Councillor Janet Rochford (Labour).
| Party | Candidate | Votes | % | ±% | |
|---|---|---|---|---|---|
| Labour | Stephen Hesling | 803 | 52.9 | ||
| UKIP | Glyn Wright | 280 | 18.4 | ||
| Conservative | Adam Kennaugh | 240 | 15.8 | ||
| Independent | Matt Simpson | 96 | 6.3 | ||
| Green | Andrew Olsen | 42 | 2.8 | ||
| BNP | Kay Pollitt | 29 | 1.9 | ||
| TUSC | Terry Simmons | 24 | 1.4 | ||
| Majority | 523 | 34.5 | |||
| Turnout | 1,518 | 16.6 | |||
| Labour hold | Swing | ||||
| Party | Candidate | Votes | % | ±% | |
|---|---|---|---|---|---|
| Labour | Neil Blower | 661 | 45.1 | −0.5 | |
| Conservative | Anne Broomhead | 298 | 20.3 | +4.3 | |
| UKIP | Robert Wakefield | 215 | 14.7 | +14.7 | |
| Green | Joe O'Neill | 196 | 13.4 | −3.4 | |
| English Democrat | Paul Whitelegg | 54 | 3.7 | −1.1 | |
| TUSC | Steve Cullen | 43 | 2.9 | +2.9 | |
| Majority | 363 | ||||
| Turnout | |||||
| Labour hold | Swing | ||||
Election followed the death of Councillor Norbert Potter (Labour).
| Party | Candidate | Votes | % | ±% | |
|---|---|---|---|---|---|
| Conservative | Arnold Saunders | 850 | 42.0 | −1.4 | |
| Labour | Mike Pevitt | 553 | 27.3 | −21.5 | |
| Independent | Jonny Wineberg | 354 | 17.5 | +17.5 | |
| UKIP | Christopher Barnes | 182 | 9.0 | +9.0 | |
| Green | Jason Reading | 48 | 2.4 | −3.4 | |
| Liberal Democrats | Adam Slack | 39 | 1.9 | +1.9 | |
| Majority | 297 | 14.6 | |||
| Turnout | 2,033 | 24.12 | |||
| Conservative gain from Labour | Swing | ||||
Election followed the death of Councillor Harry Davies (Labour).
| Party | Candidate | Votes | % | ±% | |
|---|---|---|---|---|---|
| Labour | Neil Andrew Reynolds | 3,300 | 61.58 | ||
| Conservative | Charlotte Woods | 1,455 | 27.15 | ||
| Liberal Democrats | Stef Lorenz | 319 | 5.95 | ||
| Green | Daniel Towers | 236 | 4.40 | ||
| The Republic Party | Stuart Cremins | 49 | 0.91 | ||
| Majority | 1,845 | 34.43 | |||
| Turnout | 5,384 | 65 | |||
| Labour hold | Swing | ||||
Election follows the resignation of Councillor Sareda Dirir (Labour).
| Party | Candidate | Votes | % | ±% | |
|---|---|---|---|---|---|
| Labour | Mike Pevitt | 718 | 46.50 | ||
| Conservative | Charlotte Woods | 447 | 28.95 | ||
| Independent | Mary Ferrer | 171 | 11.08 | ||
| Liberal Democrats | Stef Lorenz | 162 | 10.49 | ||
| Green | Daniel Towers | 46 | 2.98 | ||
| Majority | 271 | 17.55 | |||
| Turnout | 1,550 | 18.53 | |||
| Labour hold | Swing | ||||
Election followed the death of Councillor Joe Murphy (Labour).
| Party | Candidate | Votes | % | ±% | |
|---|---|---|---|---|---|
| Labour | Wilson Nkurunziza | 601 | 57.7 | ||
| Conservative | James Ian Mount | 183 | 17.6 | ||
| Liberal Democrats | Jake Overend | 125 | 12.0 | ||
| Green | Ian Pattinson | 72 | 6.9 | ||
| Independent | Michael James Felse | 55 | 5.3 | ||
| Majority | 476 | 45.7 | |||
| Turnout | 1,041 | 11.8 | |||
| Labour hold | Swing | ||||
Election followed the death of Councillor Paul Longshaw (Labour).
| Party | Candidate | Votes | % | ±% | |
|---|---|---|---|---|---|
| Labour | Mike McCusker* | 1,071 | 54.5 | ||
| Conservative | Andrew Darlington | 474 | 24.1 | ||
| Liberal Democrats | Jake Overend | 156 | 7.9 | ||
| Green | Helen Alker | 123 | 6.2 | ||
| UKIP | Keith Hallam | 100 | 5.1 | ||
| Women's Equality | Caroline Stephanie Dean | 39 | 2 | ||
| Majority | 597 | 30.4 | |||
| Turnout | 1966 | 20.92 | |||
| Labour hold | Swing | ||||
Election followed the resignation of Councillor Peter Wheeler (Labour).
| Party | Candidate | Votes | % | ±% | |
|---|---|---|---|---|---|
| Labour | Roseanna Wain | 408 | 51.8 | −2.3 | |
| Green | David Jones | 160 | 20.3 | −6.4 | |
| Liberal Democrats | Joseph Allen | 152 | 19.3 | +13.0 | |
| Conservative | Christopher Bates | 68 | 8.6 | +0.8 | |
| Majority | 248 | 31.5 | |||
| Turnout | 788 | 10.1 | |||
| Labour hold | Swing | ||||
Election followed the death of Councillor Raymond Walker (Labour).
| Party | Candidate | Votes | % | ±% | |
|---|---|---|---|---|---|
| Liberal Democrats | Paul Heilbron | 540 | 54.8 | +17.4 | |
| Labour | Elizabeth McCoy | 321 | 32.6 | −12.6 | |
| Green | Andrea Romero O'Brien | 124 | 12.6 | +3.4 | |
| Majority | 219 | 22.2 | |||
| Turnout | 985 | ||||
| Liberal Democrats hold | Swing | ||||
Election followed the resignation of Councillor Alex Warren (Liberal Democrats).
| Party | Candidate | Votes | % | ±% | |
|---|---|---|---|---|---|
| Labour | Elizabeth McCoy | 951 | 51.2 | −11.2 | |
| Conservative | Daniel Whitehouse | 426 | 23.0 | +6.4 | |
| Green | Sara Laing | 261 | 14.1 | +0.0 | |
| Liberal Democrats | Ian McKinlay | 142 | 7.7 | +7.7 | |
| TUSC | Sally Griffiths | 76 | 4.1 | −1.7 | |
| Majority | 525 | 28.3 | |||
| Turnout | 1,856 | ||||
| Labour (UK) hold | Swing | ||||
Election followed the resignation of Councillor Sharmina August (Labour).

Irlam is a suburb in the City of Salford, Greater Manchester, England. In 2011, it had a population of 19,933. It lies on flat ground on the south side of the M62 motorway and the north bank of the Manchester Ship Canal, 6.7 miles (10.8 km) southwest of Salford, 7.6 miles (12.2 km) southwest of Manchester and 8.3 miles (13.4 km) northeast of Warrington. Irlam forms a continuous urban area with Cadishead to the southwest, and is divided from Flixton and the Metropolitan Borough of Trafford to the southeast by the Manchester Ship Canal. The main road through Irlam, linking it to Cadishead and Eccles, is the A57. Irlam railway station also serves the district.
Seedley is an inner city suburb of Salford, Greater Manchester, England.

Weaste is an inner-city suburb of Salford, Greater Manchester, England. In 2014, Weaste and Seedley ward had a population of 12,616.

Salford City Council is the local authority for the City of Salford, a metropolitan borough with city status in Greater Manchester, England. It is a metropolitan borough council and provides the majority of local government services in the city. The council has been a member of the Greater Manchester Combined Authority since 2011.
The 2011 Salford City Council election took place on 5 May 2011 to elect members of Salford City Council in England. This was on the same day as other local elections.
Langworthy is an area of Salford, Greater Manchester. Weaste lies to the west of Langworthy and Pendleton to the east. In 2001 the population of Langworthy was 7,104, increasing to 12,935 at the 2011 Census. It was named after Edward Ryley Langworthy, a former mayor of Salford.

Boothstown and Ellenbrook is an electoral ward of Salford, England. The ward was created in 2004 following recommendations made by the Boundary Committee for England. It is represented in Westminster by Barbara Keeley MP for Worsley and Eccles South. The 2011 Census recorded a population of 9,532. Following extensive boundary changes to wards across the City of Salford, Boothstown and Ellenbrook was expanded to include the village of Roe Green. These new boundaries were first contested on 6 May 2021 in all-out elections, requiring all three ward councillors to stand for re-election.

Walkden North is an area and electoral ward of Salford, England. It is represented in Westminster by Yasmin Quereshi MP for Bolton South and Walkden. Information from the 2021 Census recorded a population of 13,555.

Walkden South is an area and electoral ward of Salford, England. It is represented in Westminster by Yasmin Quereshi MP for Bolton South and Walkden. The 2021 Census recorded a ward population of 11,715.

Irlam was an electoral ward of Salford, England. It was represented in Westminster by the constituency of Worsley and Eccles South. A profile of the ward conducted by Salford City Council in 2014 recorded a population of 9,857.

Irwell Riverside (ward) is an electoral ward of Salford, England. The ward is bounded by meanders of the River Irwell and includes the main University of Salford campus.

Little Hulton is an electoral ward of Salford, England. It is represented in Westminster by Yasmin Quereshi MP for Bolton South and Walkden. A profile of the ward conducted by Salford City Council in 2014 recorded a population of 13,469.

Worsley and Westwood Park (ward) is an electoral ward of Salford, England. It is represented in Westminster by Barbara Keeley MP for Worsley and Eccles South. A profile of the ward conducted by Salford City Council in 2014 recorded a population of 10,090. Formerly named Worsley, following extensive boundary changes to wards across the City of Salford, the ward was expanded to include Westwood Park, and the ward was renamed Worsley and Westwood Park. These new boundaries were first contested on 6 May 2021 in all-out elections, requiring all three ward councillors to stand for re-election.

Claremont (ward) is an electoral ward of Salford, England. It is represented in Westminster by Rebecca Long-Bailey MP for Salford and Eccles. A profile of the ward conducted by Salford City Council in 2014 recorded a population of 10,166.

Langworthy was an electoral ward of Salford City Council, in North-West England, located in the constituency of Salford and Eccles. A profile of the ward conducted by Salford City Council in 2014 recorded a population of 12,980.

Swinton South (ward) is an electoral ward of Salford, England. It is represented in Westminster by Rebecca Long-Bailey MP for Salford and Eccles. A profile of the ward conducted by Salford City Council in 2014 recorded a population of 11,458.

Swinton North (ward) is an electoral ward of Salford, England. It is represented in Westminster by Rebecca Long-Bailey MP for Salford and Eccles. A profile of the ward conducted by Salford City Council in 2014 recorded a population of 11,473.

Weaste and Seedley is an electoral ward of Salford, England. It is represented in Westminster by Rebecca Long-Bailey MP for Salford and Eccles. A profile of the ward conducted by Salford City Council in 2014 recorded a population of 12,616.

Ordsall (ward) is an electoral ward of Salford, England. The ward includes Ordsall itself, the Salford Quays redevelopment area and the easternmost part of Salford which adjoins Manchester city centre.
Pendlebury is an electoral ward of Salford, England. It is represented in Westminster by Rebecca Long-Bailey MP for Salford and Eccles. A profile of the ward conducted by Salford City Council in 2014 recorded a population of 13,434.