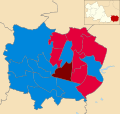
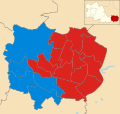
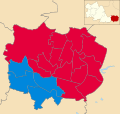
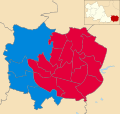
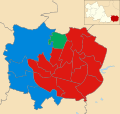
Coventry City Council elections are generally held three years out of every four, with a third of the council being elected each time. Coventry City Council is the local authority for the metropolitan borough of Coventry in the West Midlands, England. Since the last boundary changes in 2004, 54 councillors have been elected from 18 wards. [1]
Party | Candidate | Votes | % | ±% | |
---|---|---|---|---|---|
Labour | 1,674 | 49.0 | |||
Conservative | 953 | 27.9 | |||
Militant Labour | 535 | 15.6 | |||
Liberal Democrats | 255 | 7.5 | |||
Majority | 721 | 21.1 | |||
Turnout | 3,417 | 28.9 | |||
Labour hold | Swing |
Party | Candidate | Votes | % | ±% | |
---|---|---|---|---|---|
Labour | 4,801 | 63.7 | −7.2 | ||
Conservative | 1,600 | 21.2 | +2.4 | ||
Liberal Democrats | 1,136 | 15.1 | +4.8 | ||
Majority | 3,201 | 42.5 | |||
Turnout | 7,537 | 62.0 | |||
Labour hold | Swing |
Party | Candidate | Votes | % | ±% | |
---|---|---|---|---|---|
Conservative | 1,741 | 61.8 | +11.9 | ||
Labour | 673 | 23.9 | −7.8 | ||
Liberal Democrats | 360 | 12.8 | −5.6 | ||
Socialist Alliance | 44 | 1.6 | +1.6 | ||
Majority | 1,068 | 37.9 | |||
Turnout | 2,818 | 22.2 | |||
Conservative hold | Swing |
Party | Candidate | Votes | % | ±% | |
---|---|---|---|---|---|
Labour | 2,998 | 46.9 | −5.2 | ||
Conservative | 2,146 | 33.6 | −23.2 | ||
Liberal Democrats | 987 | 15.5 | +13.9 | ||
Unknown | 257 | 4.0 | +4.0 | ||
Majority | 852 | 13.3 | |||
Turnout | 6,388 | ||||
Labour hold | Swing |
Party | Candidate | Votes | % | ±% | |
---|---|---|---|---|---|
Labour | Tony Skipper | 873 | 53.5 | +2.2 | |
Liberal Democrats | Peter Simpson | 442 | 27.1 | +11.8 | |
Conservative | Gary Ridley | 316 | 19.4 | −8.4 | |
Majority | 431 | 26.4 | |||
Turnout | 1,631 | 13.0 | |||
Labour hold | Swing |
Party | Candidate | Votes | % | ±% | |
---|---|---|---|---|---|
Labour | Catherine Elizabeth Miks | 1,366 | 53.9 | −3.3 | |
Conservative | Jaswant Singh Birdi | 563 | 22.2 | −0.1 | |
Socialist Alternative | Robert McArdle | 254 | 10.0 | +3.6 | |
BNP | Keith Oxford | 149 | 5.9 | +0.2 | |
Green | Laura Vesty | 114 | 4.5 | −3.2 | |
Liberal Democrats | Mark Edward Widdop | 79 | 3.1 | N/A | |
Majority | 803 | 31.7 | |||
Turnout | 2,532 | 18.51 | |||
Labour hold | Swing |
Party | Candidate | Votes | % | ±% | |
---|---|---|---|---|---|
Labour | Rupinder Singh | 1,237 | |||
Conservative | Ellane Francoise Yebkal | 344 | |||
UKIP | Harjinder Singh Sehmi | 290 | |||
Green | Aimee Challenor | 165 | |||
Liberal Democrats | Christopher Mark Glenn | 124 | |||
Majority | 893 | ||||
Turnout | 2,160 | ||||
Labour hold | Swing |
Party | Candidate | Votes | % | ±% | |
---|---|---|---|---|---|
Conservative | Mattie Heaven | 1,560 | 53 | ||
Liberal Democrats | James Frederick Morshead | 634 | 22 | ||
Labour | Abdul Jobbar | 544 | 19 | ||
Brexit Party | George Stuart Ronald Beamish | 193 | 7 | ||
Majority | 926 | ||||
Turnout | 2,948 | ||||
Conservative hold | Swing |
Party | Candidate | Votes | % | ±% | |
---|---|---|---|---|---|
Labour | Gurdev Singh Hayre | 639 | 53 | ||
Conservative | Gurdeep Singh Sohal | 350 | 29 | ||
Green | Chrissie Lynn Brown | 120 | 10 | ||
Socialist Alternative | Jane Elizabeth Nellist | 101 | 8 | ||
Majority | 289 | ||||
Turnout | 1,210 | ||||
Labour hold | Swing |
Party | Candidate | Votes | % | ±% | |
---|---|---|---|---|---|
Labour | Seyi Agboola | 934 | 36.2 | −5.1 | |
Conservative | Amarjit Singh Khangura | 765 | 29.6 | +0.7 | |
Coventry Citizens | Paul Cowley | 746 | 28.9 | +9.6 | |
ADF | Marianne Fitzgerald | 91 | 3.5 | +0.1 | |
TUSC | Michael Morgan | 46 | 1.8 | +1.8 | |
Majority | 169 | 6.5 | |||
Turnout | 2,582 | ||||
Labour hold | Swing |
Party | Candidate | Votes | % | ±% | |
---|---|---|---|---|---|
Conservative | Jackie Gardiner | 1,409 | 51.2 | +12.3 | |
Labour | Des Arthur | 895 | 32.5 | −7.4 | |
Green | Bruce Tetlow | 139 | 5.0 | −4.2 | |
TUSC | Jane Nellist | 125 | 4.5 | +0.1 | |
Liberal Democrats | Jamie Simpson | 94 | 3.4 | −1.4 | |
Coventry Citizens | Cameron Baxter | 92 | 3.3 | +0.6 | |
Majority | 514 | 18.7 | |||
Turnout | 2,754 | ||||
Conservative gain from Labour | Swing |
Party | Candidate | Votes | % | ±% | |
---|---|---|---|---|---|
Labour | Lynette Kelly | 1,388 | 43.0 | –9.3 | |
Conservative | Zaid Rehman | 1,017 | 31.5 | +2.3 | |
Liberal Democrats | Stephen Richmond | 489 | 15.1 | +7.8 | |
Green | John Finlayson | 193 | 6.0 | –1.0 | |
Coventry Citizens | Cameron Baxter | 107 | 3.3 | +0.4 | |
TUSC | Adam Harmsworth | 37 | 1.1 | –0.2 | |
Majority | 371 | 11.5 | |||
Turnout | 3,241 | ||||
Labour hold | Swing |
Party | Candidate | Votes | % | ±% | |
---|---|---|---|---|---|
Labour | Sanjida Jobbar | 899 | 49.1 | –13.0 | |
TUSC | Dave Nellist | 327 | 17.9 | +8.7 | |
Workers Party | Ejaz Januja | 212 | 11.6 | +11.6 | |
Conservative | Mehmet Yetkin | 145 | 7.9 | –1.9 | |
Green | Thomas Jewell | 96 | 5.2 | –4.0 | |
Coventry Citizens | Karen Wilson | 94 | 5.1 | –0.1 | |
Liberal Democrats | Robyn Simpson | 57 | 3.1 | –1.0 | |
Majority | 572 | 31.3 | |||
Turnout | 1,830 | ||||
Labour hold | Swing |
Lancaster City Council elections are held every four years. Lancaster City Council is the local authority for the non-metropolitan district of Lancaster in Lancashire, England. Since the last boundary changes in 2023, 61 councillors have been elected from 27 wards.
Newcastle City Council elections are generally held three years out of every four, with a third of the council being elected each time. Newcastle City Council is the local authority for the metropolitan borough of the Newcastle upon Tyne in Tyne and Wear, England. Since the last boundary changes in 2018, 78 councillors have been elected from 26 wards.
Fylde Borough Council elections are held every four years to elect councillors to Fylde Borough Council in Lancashire, England. Since the last boundary changes in 2023 the council has comprised 37 councillors, representing 17 wards, with each ward electing one, two or three councillors.
Dudley Metropolitan Borough Council elections are held three years out of every four, with a third of the council elected each time. Dudley Metropolitan Borough Council is the local authority for the metropolitan borough of Dudley in the West Midlands, England. Since the last boundary changes in 2004, 72 councillors have been elected from 24 wards.
One third of Cambridge City Council is elected each year, followed by one year without election.
One third of Basildon Borough Council in Essex, England is elected each year, followed by one year without election. Since the last boundary changes in 2002, 42 councillors have been elected from 16 wards.
Bassetlaw District Council elections are held every four years. Prior to 2015, elections were generally held three years out of every four, with a third of the council being elected each time. Bassetlaw District Council is the local authority for the non-metropolitan district of Bassetlaw in Nottinghamshire, England. Since the last boundary changes in 2002, 48 councillors have been elected from 25 wards.
Chorley Borough Council elections are generally held three years out of every four, with a third of the council elected each time. Chorley Borough Council is the local authority for the non-metropolitan district of Chorley in Lancashire, England. Since the last boundary changes in 2020, 42 councillors have been elected from 14 wards.
Fenland District Council in Cambridgeshire, England is elected every four years. Since the last boundary changes in 2023, the council has comprised 43 councillors representing 18 wards, with each ward electing one, two or three councillors.
Warwick District Council elections are held every four years. Warwick District Council is the local authority for the non-metropolitan district of Warwick in Warwickshire, England. Since the last boundary changes in 2019, 44 councillors have been elected from 17 wards.
St Edmundsbury Borough Council in Suffolk, England, was elected every four years. After the last boundary changes in 2003, 45 councillors were elected from 31 wards. The council was abolished in 2019, with the area becoming part of West Suffolk.
East Hampshire District Council elections are held every four years to elect councillors to East Hampshire District Council in Hampshire, England. Since the last boundary changes in 2019 the council has comprised 43 councillors representing 31 wards, with each ward electing one, two or three councillors.
Watford Borough Council elections are held three years out of every four, to elect members of Watford Borough Council in Hertfordshire, England. A third of the council is elected each time. Since the last boundary changes in 2016 the council has comprised 36 councillors representing 12 wards, each of which elects three councillors. In addition to the 36 councillors Watford also has a directly-elected mayor. Elections to Hertfordshire County Council are held in the fourth year of the cycle when there are no borough council elections.
Oldham Metropolitan Borough Council elections are generally held three years out of every four, with a third of the council being elected each time. Oldham Metropolitan Borough Council, generally known as Oldham Council, is the local authority for the metropolitan borough of Oldham in Greater Manchester, England. Since the last boundary changes in 2023, 60 councillors have been elected from 20 wards.
Warwickshire County Council elections are held every four years. Warwickshire County Council is the upper-tier authority for the non-metropolitan county of Warwickshire in England. Since the last boundary changes in 2017, 57 councillors have been elected from 57 electoral divisions.
New Forest District Council elections are held every four years to elect members of New Forest District Council in Hampshire, England. Since the last boundary changes in 2023 the council has comprised 48 councillors representing 26 wards, with each ward electing one, two or three councillors.
Stratford-on-Avon District Council elections are held every four years. Stratford-on-Avon District Council is the local authority for the non-metropolitan district of Stratford-on-Avon in Warwickshire, England. Since the last boundary changes in 2023, 41 councillors have been elected from 39 wards. Prior to 2015 elections were held three years out of every four, with a third of the council elected each time.
Rossendale Borough Council elections are generally held three years out of every four, with a third of the council elected each time. Rossendale Borough Council is the local authority for the non-metropolitan district of Rossendale in Lancashire, England. Since the last boundary changes in 2002, 36 councillors have been elected from 14 wards. At the 2024 election, new ward boundaries will be in effect and the number of councillors will decrease to 30.
Hertsmere Borough Council elections are held every four years to elect members of Hertsmere Borough Council in Hertfordshire, England. Since the last boundary changes in 2019, the council comprises 39 councillors elected from 16 wards.
Nottingham City Council elections are held every four years. Nottingham City Council is the local authority for the unitary authority of Nottingham in Nottinghamshire, England. Until 1 April 1998 it was a non-metropolitan district. Since the last boundary changes in 2019, 55 councillors are elected from 20 wards.