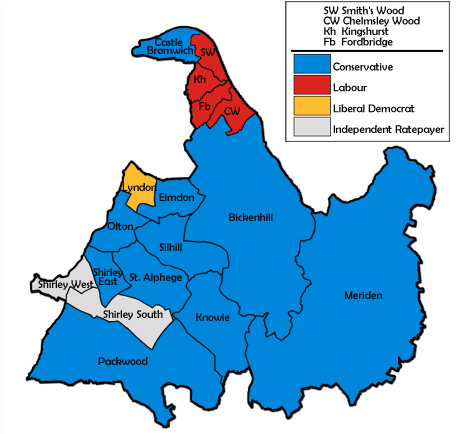
The Solihull Metropolitan Borough Council elections were held on Thursday, 7 May 1992, with one third of the council to be elected. The council remained under no overall control with the Conservatives three seats short of a majority. Voter turnout was 37.8%. [1] [2]
Party | Seats | Gains | Losses | Net gain/loss | Seats % | Votes % | Votes | +/− | |
---|---|---|---|---|---|---|---|---|---|
Conservative | 10 | 1 | 0 | +1 | 58.8 | 57.0 | 33,601 | +10.8 | |
Labour | 4 | 0 | 1 | -1 | 23.5 | 16.8 | 9,935 | -6.2 | |
Independent Ratepayers & Residents | 2 | 0 | 0 | 0 | 11.8 | 8.8 | 5,187 | +0.5 | |
Liberal Democrats | 1 | 0 | 0 | 0 | 5.9 | 15.5 | 9,165 | -3.0 | |
Green | 0 | 0 | 0 | 0 | 0.0 | 1.9 | 1,095 | -1.7 |
This result had the following consequences for the total number of seats on the council after the elections:
Party | Previous council | New council | |||
---|---|---|---|---|---|
Conservatives | 23 | 24 | |||
Labour | 16 | 15 | |||
Independent Ratepayers & Residents | 6 | 6 | |||
Liberal Democrats | 6 | 6 | |||
Total | 51 | 51 | |||
Working majority | -5 | -3 |
Party | Candidate | Votes | % | ±% | |
---|---|---|---|---|---|
Conservative | Elizabeth Plaister | 2,524 | 63.1 | +8.3 | |
Labour | Jeffrey Potts | 1,272 | 31.8 | -4.6 | |
Green | Pamela Archer | 204 | 5.1 | -3.7 | |
Majority | 1,252 | 31.3 | +12.9 | ||
Turnout | 4,000 | 40.7 | -11.6 | ||
Conservative hold | Swing | +6.4 | |||
Party | Candidate | Votes | % | ±% | |
---|---|---|---|---|---|
Conservative | George Richards | 3,017 | 77.8 | +13.7 | |
Labour | Robert Davis | 742 | 19.1 | -9.8 | |
Green | M. Dudley | 119 | 3.1 | -3.9 | |
Majority | 2,275 | 58.7 | +23.5 | ||
Turnout | 3,878 | 39.9 | -7.1 | ||
Conservative hold | Swing | +11.7 | |||
Party | Candidate | Votes | % | ±% | |
---|---|---|---|---|---|
Labour | Alfred Hill | 971 | 53.3 | -8.7 | |
Conservative | Beryl Kellie | 703 | 38.6 | +14.1 | |
Liberal Democrats | Olive Hogg | 147 | 8.1 | -5.4 | |
Majority | 268 | 14.7 | -22.8 | ||
Turnout | 1,821 | 20.7 | -7.5 | ||
Labour hold | Swing | -11.4 | |||
Party | Candidate | Votes | % | ±% | |
---|---|---|---|---|---|
Conservative | Donald Jones | 1,831 | 49.2 | +9.0 | |
Labour | Eileen Turner | 1,410 | 37.9 | -5.1 | |
Independent | Herbert Hitchcock | 481 | 12.9 | -3.9 | |
Majority | 421 | 11.3 | +8.5 | ||
Turnout | 3,722 | 44.5 | -7.8 | ||
Conservative gain from Labour | Swing | +7.0 | |||
Party | Candidate | Votes | % | ±% | |
---|---|---|---|---|---|
Labour | Michael Corser | 800 | 56.9 | -3.7 | |
Conservative | Michael Wyldbore-Smith | 494 | 35.1 | +10.2 | |
Liberal Democrats | A. Blakeley | 112 | 8.0 | -2.0 | |
Majority | 306 | 21.8 | -13.9 | ||
Turnout | 1,406 | 20.3 | -8.7 | ||
Labour hold | Swing | -6.9 | |||
Party | Candidate | Votes | % | ±% | |
---|---|---|---|---|---|
Labour | Frederick Allen | 952 | 55.2 | -9.3 | |
Conservative | Dorothy Wallace | 705 | 40.9 | +15.7 | |
Green | Trevor Barker | 68 | 3.9 | +0.3 | |
Majority | 247 | 14.3 | -25.0 | ||
Turnout | 1,725 | 27.3 | -11.3 | ||
Labour hold | Swing | -12.5 | |||
Party | Candidate | Votes | % | ±% | |
---|---|---|---|---|---|
Conservative | Leslie Kyles | 2,825 | 75.0 | +10.5 | |
Liberal Democrats | Bernadette Pruden | 750 | 19.9 | -8.1 | |
Labour | Vera Wood | 191 | 5.1 | -2.3 | |
Majority | 2,075 | 55.1 | +18.6 | ||
Turnout | 3,766 | 43.0 | -6.7 | ||
Conservative hold | Swing | +9.3 | |||
Party | Candidate | Votes | % | ±% | |
---|---|---|---|---|---|
Liberal Democrats | Richard Balmer | 1,775 | 52.0 | -4.0 | |
Conservative | Gloria Cox | 1,333 | 39.1 | +10.6 | |
Labour | Joan Holt | 305 | 8.9 | -6.5 | |
Majority | 442 | 12.9 | -14.6 | ||
Turnout | 3,413 | 41.4 | -8.0 | ||
Liberal Democrats hold | Swing | -7.3 | |||
Party | Candidate | Votes | % | ±% | |
---|---|---|---|---|---|
Conservative | Alan Vincent | 2,263 | 69.1 | +11.2 | |
Liberal Democrats | Richard Morris | 742 | 22.7 | -8.8 | |
Labour | Arthur Brill | 269 | 8.2 | -2.3 | |
Majority | 1,521 | 46.5 | +20.0 | ||
Turnout | 3,274 | 38.8 | -11.5 | ||
Conservative hold | Swing | +10.0 | |||
Party | Candidate | Votes | % | ±% | |
---|---|---|---|---|---|
Conservative | Diana Holl-Allen | 2,245 | 52.5 | +5.1 | |
Liberal Democrats | Honor Cox | 1,860 | 43.5 | -1.0 | |
Labour | A. Davis | 173 | 4.0 | -4.1 | |
Majority | 385 | 9.0 | +6.1 | ||
Turnout | 4,278 | 46.4 | -3.2 | ||
Conservative hold | Swing | +3.0 | |||
Party | Candidate | Votes | % | ±% | |
---|---|---|---|---|---|
Conservative | Kenneth Meeson | 2,858 | 62.5 | +20.0 | |
Liberal Democrats | Jennifer Wright | 1,589 | 34.8 | -15.5 | |
Labour | Frederick Bradley | 122 | 2.7 | +0.2 | |
Majority | 1,269 | 27.8 | +20.0 | ||
Turnout | 4,569 | 48.3 | -7.0 | ||
Conservative hold | Swing | +17.7 | |||
Party | Candidate | Votes | % | ±% | |
---|---|---|---|---|---|
Conservative | Theresa Samuels | 2,192 | 54.4 | +11.9 | |
Liberal Democrats | Michael Southcombe | 1,607 | 39.9 | -8.5 | |
Labour | Derek Jones | 233 | 5.8 | -3.4 | |
Majority | 585 | 14.5 | +8.6 | ||
Turnout | 4,032 | 44.2 | -4.3 | ||
Conservative hold | Swing | +10.2 | |||
Party | Candidate | Votes | % | ±% | |
---|---|---|---|---|---|
Independent | Ursula Eames | 2,787 | 53.1 | +1.8 | |
Conservative | Philip Cross | 2,152 | 41.0 | +2.3 | |
Labour | Barry Beattie | 305 | 5.8 | -4.1 | |
Majority | 635 | 12.1 | -0.4 | ||
Turnout | 5,244 | 40.4 | -6.4 | ||
Independent hold | Swing | -0.2 | |||
Party | Candidate | Votes | % | ±% | |
---|---|---|---|---|---|
Independent Ratepayers | Jane Granger | 1,919 | 55.0 | +7.3 | |
Conservative | Denis Eyre | 1,308 | 37.5 | -0.2 | |
Labour | Robert Houghton | 262 | 7.5 | -7.1 | |
Majority | 611 | 17.5 | +7.5 | ||
Turnout | 3,489 | 37.2 | -4.7 | ||
Independent Ratepayers hold | Swing | +3.7 |
Party | Candidate | Votes | % | ±% | |
---|---|---|---|---|---|
Conservative | Peter Hogarth | 2,977 | 73.4 | +12.9 | |
Liberal Democrats | Bernard Winchcombe | 583 | 14.4 | -8.2 | |
Labour | Donald Bargery | 494 | 12.2 | -4.7 | |
Majority | 2,394 | 59.0 | +21.2 | ||
Turnout | 4,054 | 40.0 | -6.0 | ||
Conservative hold | Swing | +10.6 | |||
Party | Candidate | Votes | % | ±% | |
---|---|---|---|---|---|
Labour | Graham Craig | 1,171 | 60.8 | -7.6 | |
Conservative | Richard Hubbard | 698 | 36.2 | +10.7 | |
Green | Peter May | 58 | 3.0 | -3.1 | |
Majority | 473 | 24.5 | -18.3 | ||
Turnout | 1,927 | 21.7 | -9.1 | ||
Labour hold | Swing | -9.1 | |||
Party | Candidate | Votes | % | ±% | |
---|---|---|---|---|---|
Conservative | Stephen Eyre | 3,476 | 79.3 | +17.1 | |
Green | Clifford Hards | 646 | 14.7 | -10.5 | |
Labour | J. Yeomans | 263 | 6.0 | -6.6 | |
Majority | 2,830 | 64.5 | +27.7 | ||
Turnout | 4,385 | 44.0 | -7.8 | ||
Conservative hold | Swing | +13.8 | |||
Meriden is a constituency represented in the House of Commons of the UK Parliament since 2019 by Saqib Bhatti, a Conservative. It is named after the village of Meriden, halfway between Solihull and Coventry.
Solihull is a constituency represented in the House of Commons of the UK Parliament since 2015 by Julian Knight, a Conservative.
Solihull Metropolitan Borough Council elections are generally held three years out of every four, with a third of the council being elected each time. Solihull Metropolitan Borough Council is the local authority for the metropolitan borough of Solihull in the West Midlands, England. Since the last boundary changes in 2004, 51 councillors have been elected from 17 wards.
The 1998 Solihull Metropolitan Borough Council election took place on 7 May 1998 to elect members of Solihull Metropolitan Borough Council in the West Midlands, England. One third of the council was up for election and the council stayed under no overall control.
The 2010 Solihull Metropolitan Borough Council election took place on 6 May 2010 to elect members of Solihull Metropolitan Borough Council in the West Midlands, England. One third of the council was up for election and the council stayed under no overall control.
The 1999 Solihull Metropolitan Borough Council election took place on 6 May 1999 to elect members of Solihull Metropolitan Borough Council in the West Midlands, England. One third of the council was up for election and the council stayed under no overall control.
The 2002 Solihull Metropolitan Borough Council election took place on 2 May 2002 to elect members of Solihull Metropolitan Borough Council in the West Midlands, England. One third of the council was up for election and the Conservative Party stayed in overall control of the council.
The 2006 Solihull Metropolitan Borough Council election took place on 4 May 2006 to elect members of Solihull Metropolitan Borough Council in the West Midlands, England. One third of the council was up for election and the Conservative Party stayed in overall control of the council.
The 2007 Solihull Metropolitan Borough Council election took place on 4 May 2007 to elect members of Solihull Metropolitan Borough Council in the West Midlands, England. One third of the council was up for election and the Conservative Party lost overall control of the council to no overall control.
The first elections to the newly created Solihull Metropolitan Borough Council were held on Thursday, 10 May 1973, with the entirety of the 51 seat council - three seats for each of the 17 wards - up for vote. The Local Government Act 1972 stipulated that the elected members were to shadow and eventually take over from the predecessor corporation on 1 April 1974. The order in which the councillors were elected dictated their term serving, with third-place candidates serving two years and up for re-election in 1975, second-placed three years expiring in 1976 and 1st-placed five years until 1978.
The Solihull Metropolitan Borough Council election was held on Thursday, 3 May 1984, with one third of the council to be elected and a double vacancy in Shirley West. The Conservatives retained control of the council. Voter turnout was 35.2%
The Solihull Metropolitan Borough Council elections were held on Thursday, 8 May 1986, with one third of the council to be elected. The Conservatives retained control of the council. Voter turnout was 34.6%.
The Solihull Metropolitan Borough Council election was held on Thursday, 7 May 1987, with one third of the council to be elected. The Conservatives retained control of the council. Voter turnout was 43.2%
The Solihull Metropolitan Borough Council election was held on Thursday, 5 May 1988, with one third of the council to be elected. Prior to the election, Packwood councillor, Kenneth Meeson, had defected from Independent to the Conservatives. The Conservatives retained control of the council.
The Solihull Metropolitan Borough Council elections were held on Thursday, 3 May 1990, with one third of the council to be elected. There had been a number of by-elections the previous year, with the net result being Liberal Democrat gains from the Conservatives in Shirley East and the Independent Ratepayers & Residents in Packwood. The Conservatives narrowly retained control of the council. Voter turnout was 49.5%.
The Solihull Metropolitan Borough Council elections were held on Thursday, 2 May 1991, with one third of the council as well as a double vacancy in St. Alphege to be elected. There had been a by-election in the interim, with the Independent Ratepayers & Residents gaining a seat in Shirley West from the Conservatives. The council fell to no overall control for the first time since its creation in 1973. Voter turnout was 46.0%.
The Solihull Metropolitan Borough Council elections were held on Thursday, 5 May 1994, with one third of the council and a double vacancy in Fordbridge to be elected. The council remained under no overall control with the Conservatives seven seats short of a majority. Voter turnout was 43.6%.
The Solihull Metropolitan Borough Council elections were held on Thursday, 4 May 1995, with one third of the council to be elected. The council remained under no overall control with the Conservative and Independent Ratepayer and Residents coalition continuing. Voter turnout was 36.2%.
The Solihull Metropolitan Borough Council elections were held on Thursday, 2 May 1996, with one third of the council to be elected. The council remained under no overall control, with the Conservatives and Independent Ratepayer and Residents no longer holding enough seats to continue their coalition. Voter turnout was 35.4%.
The 2022 Solihull Metropolitan Borough Council election took place on 5 May 2022 to elect members of Solihull Metropolitan Borough Council. This was on the same day as other local elections. 17 of the 51 seats were up for election.