2019 Solihull Metropolitan Borough Council election

Last updated

2019 Solihull Metropolitan Borough Council election
  2018 2 May 2019 2021  

17 (one third) out of 51 seats for the Solihull Metropolitan Borough Council
26 seats needed for a majority
 First partySecond partyThird party
  No image wide.svg No image wide.svg No image wide.svg
Party Conservative Green Liberal Democrats
Seats before32114
Seats after27146
Seat changeDecrease2.svg5Increase2.svg3Increase2.svg2
Popular vote22,42712,5126,594
Percentage45.9%25.6%13.5%
SwingDecrease2.svg0.9%Increase2.svg0.5Increase2.svg1.6%

 Fourth partyFifth party
  No image wide.svg No image wide.svg
Party Labour Independent
Seats before21
Seats after31
Seat changeIncrease2.svg1Steady2.svg
Popular vote5,8481,518
Percentage12.0%3.1%
SwingDecrease2.svg3.5%

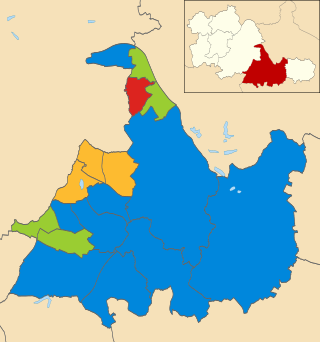
Solihull UK ward map 2019.svg
2019 local election results in Solihull
   Green
   Labour

Council control before election


Conservative

Council control after election


Conservative

The 2019 Solihull Metropolitan Borough Council election took place on 2 May 2019 to elect members of Solihull Metropolitan Borough Council in England. [1] This was on the same day as other local elections.

Contents

Results summary

2019 Solihull Metropolitan Borough Council election
PartyThis electionFull councilThis election
SeatsNetSeats %OtherTotalTotal %VotesVotes %+/−
  Conservative 8Decrease2.svg 547.1192752.922,42745.9
  Green 5Increase2.svg 329.491427.512,51225.6
  Liberal Democrats 2Increase2.svg 211.84611.86,59413.5
  Labour 1Increase2.svg 15.9235.95,84812.0
  Independent 1Steady2.svg5.9012.01,5183.1
  UKIP 0Decrease2.svg 10.0000.0

Ward results

Bickenhill

Bickenhill
PartyCandidateVotes%±%
Conservative Bob Sleigh 1,537 58.9 Increase2.svg 4.5
Labour Co-op Nick Stephens50619.4Increase2.svg 1.3
Green Trever Barker38014.6Increase2.svg 7.8
Liberal Democrats Reece Colley1857.1Increase2.svg 7.1
Majority103139.5Increase2.svg 5.8
Conservative hold Swing Increase2.svg 1.6

Blythe

Blythe
PartyCandidateVotes%±%
Conservative Ken Hawkins 2,136 70.8 Decrease2.svg 3.3
Green Carol Linfield55518.4Increase2.svg 4.2
Labour Sam Mather32610.8Decrease2.svg 0.9
Majority158152.4Decrease2.svg 7.5
Conservative hold Swing Decrease2.svg 3.8

Castle Bromwich

Castle Bromwich
PartyCandidateVotes%±%
Green Steve Caudwell 1,971 65.5 Increase2.svg 61.2
Conservative Gail Sleigh90330.0Decrease2.svg 23.1
Labour Matt Bond1354.5Decrease2.svg 18.2
Majority106835.5N/A
Green gain from Conservative Swing Increase2.svg 42.2

Chelmsley Wood

Chelmsley Wood
PartyCandidateVotes%±%
Green Karl Macnaughton 1,622 83.6 Increase2.svg 15.4
Labour Hazel Dawkins22111.4Decrease2.svg 7.5
Conservative David Skelding985.0Decrease2.svg 7.9
Majority140172.2Increase2.svg 22.9
Green hold Swing Increase2.svg 11.5

Dorridge & Hockley Heath

Dorridge & Hockley Heath
PartyCandidateVotes%±%
Conservative Andy Mackeiwicz 1,968 63.6 Decrease2.svg 8.3
Green Iona McIntyre51816.7Increase2.svg 9.4
Liberal Democrats Paul Fairburn40613.1Increase2.svg 0.8
Labour David Brittin2026.5Decrease2.svg 2.0
Majority145046.9Decrease2.svg 12.8
Conservative hold Swing Decrease2.svg 8.9

Elmdon

Elmdon
PartyCandidateVotes%±%
Liberal Democrats Peter Davies 1,383 49.3 Increase2.svg 30.9
Conservative Martin McCarthy1,15241.1Increase2.svg 9.7
Labour Margaret Brittin2699.6Decrease2.svg 0.5
Majority2318.2N/A
Liberal Democrats gain from Conservative Swing Increase2.svg 10.6

Kingshurst & Fordbridge

Kingshurst & Fordbridge
PartyCandidateVotes%±%
Labour Marcus Brain 616 39.9 Increase2.svg 9.3
Conservative Alan Feeney57537.3Increase2.svg 10.3
Green Eleanor Aldworth35222.8Increase2.svg 16.1
Majority412.7N/A
Labour gain from UKIP Swing Decrease2.svg 0.5

Knowle

Knowle
PartyCandidateVotes%±%
Independent Alan Rebeiro 1,415 41.3 Increase2.svg 41.3
Conservative Dave Pinwell1,38640.5Decrease2.svg 33.1
Green Alison Wilson2397.0Decrease2.svg 7.5
Liberal Democrats Antony Rogers1985.8Increase2.svg 5.8
Labour Simon Johnson1875.5Decrease2.svg 6.4
Majority290.8N/A
Independent gain from Conservative Swing Increase2.svg 37.2

Lyndon

Lyndon
PartyCandidateVotes%±%
Liberal Democrats Kathryn Thomas 1,086 37.8 Increase2.svg 4.4
Conservative Josh O'Nyons1,07737.5Decrease2.svg 1.2
Labour Lee Skinner70824.7Increase2.svg 5.0
Majority90.3N/A
Liberal Democrats gain from Conservative Swing Increase2.svg 2.8

Meriden

Meriden
PartyCandidateVotes%±%
Conservative Diane Howell 2,084 64.7 Increase2.svg 0.8
Green Mark Pearson47314.7Increase2.svg 7.4
Liberal Democrats Michael Carthew34810.8Increase2.svg 10.8
Labour Teresa Beddis3159.8Decrease2.svg 4.4
Majority161150.0Increase2.svg 0.7
Conservative hold Swing Decrease2.svg 3.3

Olton

Olton
PartyCandidateVotes%±%
Conservative Bob Grinsell 1,693 48.4 Increase2.svg 1.1
Liberal Democrats Brad Tucker1,35338.7Increase2.svg 5.8
Labour Colin Palmer45212.9Increase2.svg 1.1
Majority3409.7Decrease2.svg 4.7
Conservative hold Swing Decrease2.svg 2.4

Shirley East

Shirley East
PartyCandidateVotes%±%
Conservative Mark Parker 1,535 58.8 Increase2.svg 5.7
Liberal Democrats Gayle Monk44317.0Decrease2.svg 6.0
Green Antony Lowe43716.7Increase2.svg 7.0
Labour Deon Bailey2967.5Decrease2.svg 6.7
Majority109240.3Increase2.svg 10.2
Conservative hold Swing Increase2.svg 5.9

Shirley South

Shirley South
PartyCandidateVotes%±%
Green Shahin Ashraf 2,206 61.5 Increase2.svg 40.4
Conservative Angela Sandison1,13731.7Decrease2.svg 9.4
Labour Susan Bliss2426.8Decrease2.svg 2.3
Majority106929.8N/A
Green gain from Conservative Swing Increase2.svg 24.9

Shirley West

Shirley West
PartyCandidateVotes%±%
Green Rosemary Sexton 1,876 61.0 Increase2.svg 35.4
Conservative Brian Holmes74624.3Decrease2.svg 9.1
Labour Kevin Round45314.7Increase2.svg 3.4
Majority1,13036.7N/A
Green gain from Conservative Swing Increase2.svg 22.3

Silhill

Silhill
PartyCandidateVotes%±%
Conservative Wazma Qais 1,621 53.1 Decrease2.svg 4.9
Liberal Democrats James Edwardson60719.9Decrease2.svg 4.1
Green Elaine Williams41813.7Increase2.svg 7.6
Labour Co-op Janet Marsh40913.4Increase2.svg 1.5
Majority101433.2Decrease2.svg 0.8
Conservative hold Swing Decrease2.svg 0.4

Smith's Wood

Smith's Wood
PartyCandidateVotes%±%
Green Mark Wilson 1,070 70.1 Increase2.svg 8.9
Labour Bill Lloyd22614.8Decrease2.svg 9.4
Conservative Angus Young1288.4Decrease2.svg 6.2
Independent Adrian Duffen1036.7Increase2.svg 6.7
Majority84455.3Increase2.svg 18.3
Green hold Swing Increase2.svg 9.2

St. Alphege

St. Alphege
PartyCandidateVotes%±%
Conservative Joe Tildesley 2,651 67.7 Decrease2.svg 1.1
Liberal Democrats Bruce Stone58514.9Decrease2.svg 1.9
Green Joelle Hill39510.1Increase2.svg 3.9
Labour Ian English2857.3Decrease2.svg 0.8
Majority206652.8Increase2.svg 0.8
Conservative hold Swing Increase2.svg 0.4

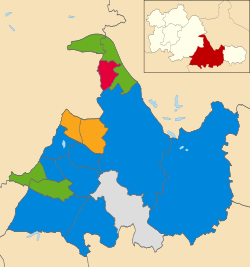
Related Research Articles

<span class="mw-page-title-main">Metropolitan Borough of Solihull</span> Metropolitan borough in England

The Metropolitan Borough of Solihull is a metropolitan borough in West Midlands county, England. It is named after its largest town, Solihull, from which Solihull Metropolitan Borough Council is based. For Eurostat purposes it is a NUTS 3 region and is one of seven boroughs or unitary districts that comprise the "West Midlands" NUTS 2 region. Much of the large residential population in the north of the borough centres on the communities of Castle Bromwich, Kingshurst, Marston Green and Smith's Wood as well as the towns of Chelmsley Wood and Fordbridge. In the south are the towns of Shirley and Solihull, as well as the large villages of Knowle, Dorridge, Meriden and Balsall Common.

Solihull Metropolitan Borough Council elections are generally held three years out of every four, with a third of the council being elected each time. Solihull Metropolitan Borough Council is the local authority for the metropolitan borough of Solihull in the West Midlands, England. Since the last boundary changes in 2004, 51 councillors have been elected from 17 wards.

<span class="mw-page-title-main">Solihull Metropolitan Borough Council</span>

Solihull Metropolitan Borough Council is the local council of the Metropolitan Borough of Solihull in the West Midlands, England. It is a metropolitan district council, one of seven in the West Midlands and one of 36 in the metropolitan counties of England, and provides the majority of local government services in Solihull.

<span class="mw-page-title-main">1998 Solihull Metropolitan Borough Council election</span>

The 1998 Solihull Metropolitan Borough Council election took place on 7 May 1998 to elect members of Solihull Metropolitan Borough Council in the West Midlands, England. One third of the council was up for election and the council stayed under no overall control.

<span class="mw-page-title-main">Warwickshire County Council</span>

Warwickshire County Council is the county council that governs the non-metropolitan county of Warwickshire in England. Its headquarters are at Shire Hall in the centre of Warwick, the county town. The council's principal functions are county roads and rights of way, social services, education and libraries, but it also provides numerous other local government services in its area.

<span class="mw-page-title-main">2008 Solihull Metropolitan Borough Council election</span>

The 2008 Solihull Metropolitan Borough Council election took place on 1 May 2008 to elect members of Solihull Metropolitan Borough Council in the West Midlands, England. One third of the council was up for election and the Conservative Party gained overall control of the council from no overall control.

<span class="mw-page-title-main">2010 Solihull Metropolitan Borough Council election</span>

The 2010 Solihull Metropolitan Borough Council election took place on 6 May 2010 to elect members of Solihull Metropolitan Borough Council in the West Midlands, England. One third of the council was up for election and the council stayed under no overall control.

<span class="mw-page-title-main">1999 Solihull Metropolitan Borough Council election</span> 1999 UK local government election

The 1999 Solihull Metropolitan Borough Council election took place on 6 May 1999 to elect members of Solihull Metropolitan Borough Council in the West Midlands, England. One third of the council was up for election and the council stayed under no overall control.

<span class="mw-page-title-main">2000 Solihull Metropolitan Borough Council election</span> Local election in the UK

The 2000 Solihull Metropolitan Borough Council election took place on 4 May 2000 to elect members of Solihull Metropolitan Borough Council in the West Midlands, England. One third of the council was up for election and the Conservative party gained overall control of the council from no overall control.

<span class="mw-page-title-main">2002 Solihull Metropolitan Borough Council election</span>

The 2002 Solihull Metropolitan Borough Council election took place on 2 May 2002 to elect members of Solihull Metropolitan Borough Council in the West Midlands, England. One third of the council was up for election and the Conservative Party stayed in overall control of the council.

<span class="mw-page-title-main">2003 Solihull Metropolitan Borough Council election</span> 2003 UK local government election

The 2003 Solihull Metropolitan Borough Council election took place on 1 May 2003 to elect members of Solihull Metropolitan Borough Council in the West Midlands, England. One third of the council was up for election and the Conservative Party stayed in overall control of the council.

<span class="mw-page-title-main">2004 Solihull Metropolitan Borough Council election</span>

The 2004 Solihull Metropolitan Borough Council election took place on 10 June 2004 to elect members of Solihull Metropolitan Borough Council in the West Midlands, England. The whole council was up for election with boundary changes since the last election in 2003. The Conservative Party stayed in overall control of the council.

<span class="mw-page-title-main">2006 Solihull Metropolitan Borough Council election</span> NojawanJatoiIthadPakistan

The 2006 Solihull Metropolitan Borough Council election took place on 4 May 2006 to elect members of Solihull Metropolitan Borough Council in the West Midlands, England. One third of the council was up for election and the Conservative Party stayed in overall control of the council.

<span class="mw-page-title-main">2007 Solihull Metropolitan Borough Council election</span> 2007 UK local government election

The 2007 Solihull Metropolitan Borough Council election took place on 4 May 2007 to elect members of Solihull Metropolitan Borough Council in the West Midlands, England. One third of the council was up for election and the Conservative Party lost overall control of the council to no overall control.

<span class="mw-page-title-main">2012 Solihull Metropolitan Borough Council election</span> 2012 UK local government election

The 2012 Solihull Metropolitan Borough Council election took place on 3 May 2012 to elect members of Solihull Metropolitan Borough Council in the West Midlands, England. One third of the council was up for election. The shock result of the election came in Blythe where the Independent Ratepayers ousted a Tory Incumbent. Prior to the election, the defending councillor in Shirley West had joined the Greens, having previously sat as an Independent Liberal Democrat. Following the election another Shirley West Liberal Democrat councillor, Andy Hodgson, joined the Greens, taking their total up to 6 seats, and the Liberal Democrats down to 10.

<span class="mw-page-title-main">2015 Solihull Metropolitan Borough Council election</span> 2015 local election in England, UK

The 2015 Solihull Metropolitan Borough Council election took place on 7 May 2015 to elect members of the Solihull Metropolitan Borough Council in England. It was held on the same day as other local elections and on the same day as the General Election.
<span class="mw-page-title-main">2016 Solihull Metropolitan Borough Council election</span>

The 2016 Solihull Metropolitan Borough Council election took place on 5 May 2016 to elect members of Solihull Metropolitan Borough Council in England. This was on the same day as other local elections.

<span class="mw-page-title-main">2018 Solihull Metropolitan Borough Council election</span> 2018 local election in England, UK

The 2018 Solihull Metropolitan Borough Council election took place on 3 May 2018 to elect members of Solihull Metropolitan Borough Council in England. This was on the same day as other local elections.

<span class="mw-page-title-main">2021 Solihull Metropolitan Borough Council election</span> 2021 UK local government election

The 2021 Solihull Metropolitan Borough Council election took place on 6 May 2021 to elect members of Solihull Metropolitan Borough Council in England. This was on the same day as other local elections. One-third of the seats were up for election.

<span class="mw-page-title-main">2022 Solihull Metropolitan Borough Council election</span>

The 2022 Solihull Metropolitan Borough Council election took place on 5 May 2022 to elect members of Solihull Metropolitan Borough Council. This was on the same day as other local elections. 17 of the 51 seats were up for election.
References

  1. "Local election results 2019". Archived from the original on 27 September 2020. Retrieved 4 March 2020.