| ||||||||||||||||||||||||||||||||||||||||
All 36 seats to Torridge District Council 19 seats needed for a majority | ||||||||||||||||||||||||||||||||||||||||
---|---|---|---|---|---|---|---|---|---|---|---|---|---|---|---|---|---|---|---|---|---|---|---|---|---|---|---|---|---|---|---|---|---|---|---|---|---|---|---|---|
| ||||||||||||||||||||||||||||||||||||||||
Results map by ward | ||||||||||||||||||||||||||||||||||||||||
|
The 2019 Torridge Council election took place on 2 May 2019 to elect members of Torridge District Council in England. [1] This was on the same day as other local elections. The whole council was up for election on new boundaries. [2]
2019 Torridge District Council election | ||||||||||
---|---|---|---|---|---|---|---|---|---|---|
Party | Candidates | Seats | Gains | Losses | Net gain/loss | Seats % | Votes % | Votes | +/− | |
Independent | 29 | 18 | N/A | N/A | 12 | 50.0 | 35.2 | 12,431 | +18.4 | |
Conservative | 28 | 11 | N/A | N/A | 8 | 30.6 | 29.2 | 10,310 | –8.8 | |
Labour | 19 | 3 | N/A | N/A | 2 | 8.3 | 12.0 | 4,238 | +1.0 | |
Liberal Democrats | 11 | 2 | N/A | N/A | 1 | 5.6 | 10.9 | 3,848 | +6.0 | |
Green | 7 | 2 | N/A | N/A | 5.6 | 8.9 | 3,151 | –5.5 | ||
UKIP | 6 | 0 | N/A | N/A | 7 | 0.0 | 3.9 | 1,369 | –10.9 |
Incumbents are denoted by an asterisk (*)
Party | Candidate | Votes | % | ±% | |
---|---|---|---|---|---|
Independent | Leonard Ford | 410 | 34.1 | ||
Green | Peter Hames | 391 | 32.5 | ||
Conservative | Andrew Eastman* | 379 | 31.5 | ||
UKIP | Kenneth Davis* | 285 | 23.7 | ||
Liberal Democrats | David Chalmers | 254 | 21.1 | ||
Independent | Barry Edwards | 207 | 17.2 | ||
Conservative | James Jackson | 128 | 10.6 | ||
Majority | |||||
Turnout | 41.37 | ||||
Independent win (new seat) | |||||
Green win (new seat) |
Party | Candidate | Votes | % | ±% | |
---|---|---|---|---|---|
Independent | Judith Gubb | 407 | 36.2 | ||
Labour | Ruth Craigie | 330 | 29.3 | ||
Independent | Jamie McKenzie | 266 | 23.6 | ||
Conservative | James Hellyer* | 255 | 22.7 | ||
Conservative | Linda Hellyer | 249 | 22.1 | ||
Labour | Ethne Brenton | 234 | 20.8 | ||
UKIP | Gaston Dezart* | 215 | 19.1 | ||
Conservative | Oliver Sherborne | 187 | 16.6 | ||
Green | Gregory De Frayne-Martin | 183 | 16.3 | ||
Independent | Pauline Davies | 174 | 15.5 | ||
Labour | Theodoros Plowman | 167 | 14.8 | ||
Liberal Democrats | Nicola Kennelly | 136 | 12.1 | ||
Majority | |||||
Turnout | 27.23 | ||||
Independent win (new seat) | |||||
Labour win (new seat) | |||||
Independent win (new seat) |
Party | Candidate | Votes | % | ±% | |
---|---|---|---|---|---|
Green | Peter Christie* | 861 | 50.5 | ||
Independent | Douglas Bushby | 641 | 37.6 | ||
Conservative | Dermot McGeough* | 615 | 36.1 | ||
Independent | Joel Herron | 320 | 18.8 | ||
Labour | Rosemary Arno | 304 | 17.8 | ||
Liberal Democrats | Trevor Johns* | 301 | 17.7 | ||
Independent | Ashley Cole | 300 | 17.6 | ||
Labour | Michael James | 265 | 15.6 | ||
Conservative | Morgan Fletcher | 242 | 14.2 | ||
Liberal Democrats | Stephen Potts | 182 | 10.7 | ||
Labour | Jason Noble | 167 | 9.8 | ||
Majority | |||||
Turnout | 37.65 | ||||
Green win (new seat) | |||||
Independent win (new seat) | |||||
Conservative win (new seat) |
Party | Candidate | Votes | % | ±% | |
---|---|---|---|---|---|
Labour | David Brenton* | 206 | 32.1 | ||
Labour | Shirley Langford | 206 | 32.1 | ||
Conservative | Simon Inch* | 198 | 30.9 | ||
Independent | Peter Lawrence | 176 | 27.5 | ||
Independent | Robert Wootton | 153 | 23.9 | ||
UKIP | Adam Conabere | 111 | 17.3 | ||
Liberal Democrats | Claire Davey-Potts | 78 | 12.2 | ||
Majority | |||||
Turnout | 26.97 | ||||
Labour win (new seat) | |||||
Labour win (new seat) |
Party | Candidate | Votes | % | ±% | |
---|---|---|---|---|---|
Independent | Carl Hawkins | 215 | 36.1 | ||
Conservative | Anthony Inch* | 197 | 33.1 | ||
Independent | Alan Rayner | 192 | 32.3 | ||
Labour | Jake McLean | 166 | 27.9 | ||
Labour | Andrew Tithecott | 129 | 21.7 | ||
UKIP | Nigel Johnson | 127 | 21.3 | ||
Majority | |||||
Turnout | 28.09 | ||||
Independent win (new seat) | |||||
Conservative win (new seat) |
Party | Candidate | Votes | % | ±% | |
---|---|---|---|---|---|
Independent | Peter Watson* | 667 | 60.0 | ||
Independent | Philip Hackett* | 666 | 59.9 | ||
Conservative | Zygmunt Gregorek* | 350 | 31.5 | ||
Conservative | Graeme Barriball | 330 | 29.7 | ||
Majority | |||||
Turnout | 34.77 | ||||
Independent win (new seat) | |||||
Independent win (new seat) |
Party | Candidate | Votes | % | ±% | |
---|---|---|---|---|---|
Liberal Democrats | Cheryl Cottle-Hunkin* | 908 | 64.9 | ||
Liberal Democrats | Christopher Bright | 552 | 39.4 | ||
Independent | Margaret Brown* | 526 | 37.6 | ||
Green | Keith Funnell | 332 | 23.7 | ||
Labour | Diana Davey | 328 | 23.4 | ||
Independent | Jonathan Rose | 258 | 18.4 | ||
Labour | Siobhan Strode | 225 | 16.1 | ||
Independent | Douglas Smith | 219 | 15.6 | ||
Majority | |||||
Turnout | 32.27 | ||||
Liberal Democrats win (new seat) | |||||
Independent win (new seat) |
Party | Candidate | Votes | % | ±% | |
---|---|---|---|---|---|
Conservative | Stephen Harding | 656 | 37.2 | ||
Conservative | Richard Boughton | 650 | 36.9 | ||
Independent | Anna Dart* | 630 | 35.7 | ||
Green | Mireille Thornton | 571 | 32.4 | ||
Independent | Robin Julian* | 470 | 26.7 | ||
Liberal Democrats | Martin Hill | 463 | 26.3 | ||
Conservative | Brian Redwood | 460 | 26.1 | ||
Labour | Dylan Billson | 340 | 19.3 | ||
Majority | |||||
Turnout | 38.14 | ||||
Conservative win (new seat) | |||||
Independent win (new seat) |
Party | Candidate | Votes | % | ±% | |
---|---|---|---|---|---|
Conservative | Jonathan Hutchings* | 607 | 74.0 | ||
Conservative | David Jones | 398 | 48.5 | ||
Independent | Valentina Kassam | 203 | 24.8 | ||
Majority | |||||
Turnout | 33.91 | ||||
Conservative win (new seat) | |||||
Conservative win (new seat) |
Party | Candidate | Votes | % | ±% | |
---|---|---|---|---|---|
Conservative | Kit Hepple | Unopposed | N/A | ||
Independent | Ken James* | Unopposed | N/A | ||
Turnout | N/A | ||||
Conservative hold | Swing | ||||
Independent hold | Swing | ||||
Party | Candidate | Votes | % | ±% | |
---|---|---|---|---|---|
Independent | Philip Pennington* | 737 | 60.3 | ||
Independent | Robert Hicks* | 659 | 53.9 | ||
Green | William Douglas-Mann | 319 | 26.1 | ||
Conservative | Kenton Baker | 237 | 19.4 | ||
Conservative | Peter Haselhurst | 182 | 14.9 | ||
Majority | |||||
Turnout | 38.93 | ||||
Independent win (new seat) | |||||
Independent win (new seat) |
Party | Candidate | Votes | % | ±% | |
---|---|---|---|---|---|
Independent | Christopher Leather | 783 | 47.9 | ||
Independent | Joanne Manley | 602 | 36.8 | ||
Independent | Giuseppe Rossi | 539 | 33.0 | ||
Conservative | John Himan* | 381 | 23.3 | ||
Conservative | Keith Lane | 372 | 22.8 | ||
UKIP | Richard Hancock* | 305 | 18.7 | ||
Conservative | William Gewanter | 296 | 18.1 | ||
Liberal Democrats | David Berryman | 255 | 15.6 | ||
Labour | John Coats | 214 | 13.1 | ||
Labour | Geoffrey Allen | 209 | 12.8 | ||
Labour | Brendan Montague | 175 | 10.7 | ||
Majority | |||||
Turnout | 40.20 | ||||
Independent win (new seat) | |||||
Independent win (new seat) |
Party | Candidate | Votes | % | ±% | |
---|---|---|---|---|---|
Conservative | David Hurley* | 599 | 45.9 | ||
Independent | Richard Wiseman* | 486 | 37.2 | ||
Liberal Democrats | Christopher Styles-Power | 470 | 36.0 | ||
Conservative | Rhys Matthews | 420 | 32.2 | ||
Labour | Gillian Tesh | 210 | 16.1 | ||
Majority | |||||
Turnout | 43.82 | ||||
Conservative win (new seat) | |||||
Independent win (new seat) |
Party | Candidate | Votes | % | ±% | |
---|---|---|---|---|---|
Conservative | Rosemary Lock* | 732 | 59.0 | ||
Conservative | Michael Clarke | 640 | 51.6 | ||
Green | Colin Jones | 494 | 39.8 | ||
Labour | Anthony Goldstone | 265 | 21.4 | ||
Majority | |||||
Turnout | 38.85 | ||||
Conservative win (new seat) | |||||
Conservative win (new seat) |
Party | Candidate | Votes | % | ±% | |
---|---|---|---|---|---|
Independent | Nicholas Laws* | 953 | 77.1 | ||
Independent | Claire Hodson | 572 | 46.3 | ||
UKIP | Derek Sargent | 326 | 26.4 | ||
Conservative | Carrie Woodhouse | 231 | 18.7 | ||
Majority | |||||
Turnout | 41.87 | ||||
Independent win (new seat) | |||||
Independent win (new seat) |
Party | Candidate | Votes | % | ±% | |
---|---|---|---|---|---|
Conservative | Simon Newton | 319 | 47.9 | ||
Liberal Democrats | Stephen Middlton | 249 | 37.4 | ||
Labour | Angela Findlay | 98 | 14.7 | ||
Majority | |||||
Turnout | 40.52 | ||||
Conservative win (new seat) |
Party | Candidate | Votes | % | ±% | |
---|---|---|---|---|---|
Conservative | Carrie Woodhouse | 386 | 38.7 | +15.4 | |
Liberal Democrats | Sam Newman-McKie | 230 | 23.1 | +7.5 | |
Green | Wendy Lo-Vel | 224 | 22.5 | N/A | |
Labour | Jennifer Radford | 103 | 10.3 | -2.8 | |
Independent | Timothy Tennant | 54 | 5.4 | N/A | |
Majority | 156 | 15.6 | |||
Turnout | 997 | ||||
Conservative gain from Independent | Swing | ||||
Torridge is a local government district in north Devon, England. Its council is based in Bideford. Other towns and villages in the district include Holsworthy, Great Torrington, Hartland, and Westward Ho!. The island of Lundy is administratively part of the district. To the south of the district bordering Cornwall, near Welcombe, the rugged coastline has a wild untouched beauty, due to its inaccessibility, but the South West Coast Path is well defined. The district is named after the River Torridge.
Torridge and West Devon is a constituency represented in the House of Commons of the UK Parliament since 2005 by Geoffrey Cox, a Conservative.
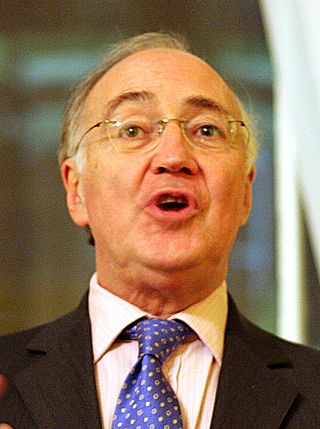
The 2005 United Kingdom local elections were held on Thursday 5 May 2005, with various councils and local government seats being contested in England and Northern Ireland, and a local referendum taking place on the Isle of Wight on the issue of a directly elected mayor. These local elections were held in conjunction with the 2005 general election across the entire United Kingdom.
One third of Carlisle City Council in Cumbria, England, was elected each year, followed by one year without election.
One third of Crawley Borough Council in West Sussex, England is elected each year, followed by one year without election. Since the last boundary changes in 2019, 36 councillors have been elected from 13 wards.
West Berkshire Council is the local authority for West Berkshire, a unitary authority in Berkshire, England. Until 1 April 1998 it was a non-metropolitan district.
Mid Devon District Council in Devon, England is elected every four years. Since the last boundary changes in 2003, 42 councillors have been elected from 24 wards.
West Devon Borough Council in Devon, England is elected every four years. Since the last boundary changes in 2015, 31 councillors have been elected from 18 wards.
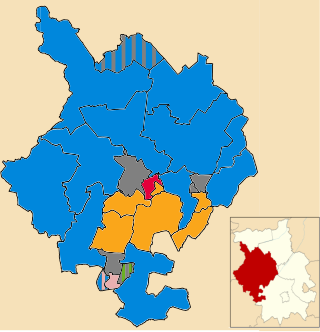
Huntingdonshire District Council in Cambridgeshire, England holds elections for all its councillors together every fourth year. Prior to changing to all-out elections in 2018, one third of the council was elected each year, followed by one year without an election. Since the last boundary changes in 2017, 52 councillors have been elected from 26 wards.
One third of Harlow District Council in Essex, England, is elected each year, followed by one year when there is an election to Essex County Council instead. Since the last boundary changes in 2002, 33 councillors have been elected from 11 wards.
Wychavon District Council elections are held every four years. Wychavon District Council is the local authority for the non-metropolitan district of Wychavon in Worcestershire, England. Since the last boundary changes in 2003, 45 councillors have been elected from 32 wards.
Torridge District Council in Devon, England is elected every four years. Since the last boundary changes in 2003, 36 councillors have been elected from 23 wards.
The 1999 Torridge District Council election took place on 6 May 1999 to elect members of Torridge District Council in Devon, England. The whole council was up for election and independents gained overall control of the council from no overall control.
The 2003 Torridge District Council election took place on 1 May 2003 to elect members of Torridge District Council in Devon, England. The whole council was up for election after boundary changes and the council stayed under no overall control.
The 2007 Torridge District Council election took place on 3 May 2007 to elect members of Torridge District Council in Devon, England. The whole council was up for election and independents lost overall control of the council to no overall control.
The 2011 Torridge District Council election took place on 5 May 2011 to elect members of Torridge District Council in Devon, England. The whole council was up for election and the council stayed under no overall control.
The 2015 Torridge District Council election took place on 7 May 2015 to elect members of Torridge District Council in England. This was on the same day as other local elections and the 2015 UK General Election hence turnout was much higher than usual Local Elections.
The 2019 United Kingdom local elections took place on Thursday 2 May 2019, with 248 English local councils, six directly elected mayors in England, and all 11 local councils in Northern Ireland being contested.
The 2022 United Kingdom local elections took place on Thursday 5 May 2022. These included elections for all London borough councils, for all local authorities in Wales and Scotland. Most seats in England were last up for election in 2018 and in Scotland and Wales in 2017. The elections coincided with the 2022 Northern Ireland Assembly election. In 91 cases, most of them in Wales, council seats were uncontested, each having only one candidate. Three seats in Scotland remained unfilled as no one nominated to fill them.