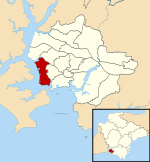
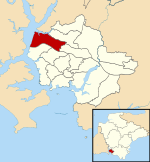
| ||||||||||||||||||||||||||||
19 of the 57 seats to Plymouth City Council 29 seats needed for a majority | ||||||||||||||||||||||||||||
---|---|---|---|---|---|---|---|---|---|---|---|---|---|---|---|---|---|---|---|---|---|---|---|---|---|---|---|---|
| ||||||||||||||||||||||||||||
Map showing the results of contested wards in the 2008 Plymouth City Council elections. | ||||||||||||||||||||||||||||
|
The 2008 Plymouth City Council election was held on 1 May 2008 to elect members of Plymouth City Council in England. One third of the council was up for election and the Conservative Party remained in control of the council with an increased majority. [2] [3]
Party | Seats | Gains | Losses | Net gain/loss | Seats % | Votes % | Votes | +/− | |
---|---|---|---|---|---|---|---|---|---|
Conservative | 14 | 6 | 0 | 6 | 73.7 | 47.3 | 28,041 | ||
Labour | 5 | 0 | 6 | 6 | 26.3 | 27.1 | 16,063 | ||
Liberal Democrats | 0 | 0 | 0 | 0.0 | 13.7 | 8,115 | |||
UKIP | 0 | 0 | 0 | 0.0 | 4.5 | 2,655 | |||
Green | 0 | 0 | 0 | 0.0 | 4.6 | 2,710 | |||
Independent | 0 | 0 | 0 | 0.0 | 2.0 | 1,173 | |||
BNP | 0 | 0 | 0 | 0.0 | 1.0 | 571 | |||
Total | 19 | 59,328 |
Note: All changes in vote share are in comparison to the corresponding 2004 election.
Party | Candidate | Votes | % | |
---|---|---|---|---|
Conservative | Jack Thompson | 1,717 | 53.8% | |
Labour | Chris Mavin | 987 | 30.9% | |
Liberal Democrats | Tracy Lang | 488 | 15.3% | |
Majority | 730 | 22.9% | ||
Turnout | 3,192 | 33.9% | ||
Conservative gain from Labour |
Party | Candidate | Votes | % | |
---|---|---|---|---|
Conservative | Richard Ball | 1,947 | 57.6% | |
Liberal Democrats | Emma Swann | 478 | 14.1% | |
Labour | Ross Burns | 470 | 13.9% | |
Green | Josie Bannon | 252 | 7.5% | |
UKIP | Andrew Leigh | 234 | 6.9% | |
Majority | 1,469 | 43.4% | ||
Turnout | 3,381 | 37.5% | ||
Conservative hold |
Party | Candidate | Votes | % | |
---|---|---|---|---|
Labour | Nicola Wildy | 1,050 | 41.8% | |
Conservative | Betty Gray | 954 | 38.0% | |
Liberal Democrats | Charles Earl | 310 | 12.3% | |
Green | Colin Bannon | 198 | 7.9% | |
Majority | 96 | 3.8% | ||
Turnout | 2,512 | 27.0% | ||
Labour hold |
Party | Candidate | Votes | % | |
---|---|---|---|---|
Labour | Brian Vincent | 1,366 | 44.5% | |
Conservative | Mary Orchard | 1,055 | 34.3% | |
Liberal Democrats | Simon Hayes | 387 | 12.6% | |
Green | Colin Trier | 2,658.6% | ||
Majority | 311 | 10.1% | ||
Turnout | 3,073 | 32.2% | ||
Labour hold |
Party | Candidate | Votes | % | |
---|---|---|---|---|
Conservative | Peter Brookshaw | 1,828 | 47.2% | |
Labour | John Smith | 861 | 22.2% | |
Independent | Lee Finn | 682 | 17.6% | |
Liberal Democrats | Laura Walker | 333 | 8.6% | |
Green | Raymond Delamare | 170 | 4.4% | |
Majority | 967 | 25.0% | ||
Turnout | 3,874 | 37.9% | ||
Conservative hold |
Party | Candidate | Votes | % | |
---|---|---|---|---|
Labour | Christopher Pattison | 1,207 | 41.3% | |
Conservative | Frederick Brimacombe | 1,158 | 39.6% | |
Liberal Democrats | Stephen Goldthorpe | 387 | 13.2% | |
Green | Andrew Pratt | 173 | 5.9% | |
Majority | 49 | 1.7% | ||
Turnout | 2,925 | 30.3% | ||
Labour hold |
Party | Candidate | Votes | % | |
---|---|---|---|---|
Labour | Peter Smith | 1,135 | 41.4% | |
Conservative | Paul Rielly | 935 | 34.1% | |
Liberal Democrats | Gillian Hirst | 433 | 15.8% | |
Green | Nicholas Byrne | 241 | 8.8% | |
Majority | 200 | 7.3% | ||
Turnout | 2,744 | 26.9% | ||
Labour hold |
Party | Candidate | Votes | % | |
---|---|---|---|---|
Conservative | Edward Delbridge | 1,453 | 43.7% | |
Labour | Paul Hutchings | 1,153 | 34.7% | |
Liberal Democrats | David Jolly | 311 | 9.4% | |
UKIP | Richard Barrett | 297 | 8.9% | |
Green | Nicola Bannon | 111 | 3.3% | |
Majority | 300 | 9.0% | ||
Turnout | 3,325 | 35.8% | ||
Conservative gain from Labour |
Party | Candidate | Votes | % | |
---|---|---|---|---|
Conservative | Patricia Nicholson | 2,036 | 55.1% | |
Labour | John Sewell | 626 | 17.0% | |
Green | Don Allen | 521 | 14.1% | |
Liberal Democrats | Deborah Earl | 510 | 13.8% | |
Majority | 1,410 | 38.2% | ||
Turnout | 3,693 | 36.9% | ||
Labour hold |
Party | Candidate | Votes | % | |
---|---|---|---|---|
Conservative | David Salter | 1,133 | 60.0% | |
Labour | Pauline Murphy | 300 | 15.9% | |
UKIP | Jonathan Frost | 233 | 12.3% | |
Liberal Democrats | Steve Barton | 223 | 11.8% | |
Majority | 833 | 44.1% | ||
Turnout | 1,889 | 33.8% | ||
Conservative hold |
Party | Candidate | Votes | % | |
---|---|---|---|---|
Conservative | John Lock | 1,499 | 60.4% | |
Labour | Valerie Burns | 391 | 15.8% | |
Liberal Democrats | Wesley Rowe | 347 | 14.0% | |
UKIP | John Roberts | 243 | 9.8% | |
Majority | 1,108 | 44.7% | ||
Turnout | 2,480 | 36.2% | ||
Conservative hold |
Note: This Plympton Erle seat was won by Lock for the Liberal Democrats the previous time it was contested in 2004, but he defected to the Conservatives in 2007. [4]
Party | Candidate | Votes | % | |
---|---|---|---|---|
Conservative | Samantha Leaves | 2,283 | 61.3% | |
Labour | Darren Jones | 461 | 12.4% | |
Liberal Democrats | Liz Barton | 385 | 10.3% | |
Independent | James Sanderson | 304 | 8.2% | |
UKIP | Hugh Williams | 291 | 7.8% | |
Majority | 1,822 | 48.9% | ||
Turnout | 3,724 | 37.3% | ||
Conservative hold |
Party | Candidate | Votes | % | |
---|---|---|---|---|
Conservative | Kevin Wigens | 2,300 | 59.2% | |
Liberal Democrats | Stephen Kearney | 636 | 16.4% | |
Labour | Mike Fox | 477 | 12.3% | |
UKIP | Alan Skuse | 417 | 10.7% | |
Independent | Bruce Abbott | 53 | 1.4% | |
Majority | 1,664 | 42.9% | ||
Turnout | 3,883 | 39.8% | ||
Conservative hold |
Party | Candidate | Votes | % | |
---|---|---|---|---|
Conservative | Michael Leaves | 1,962 | 54.5% | |
Labour | Julia Olsen | 686 | 19.0% | |
UKIP | Roger Bullock | 508 | 14.1% | |
Liberal Democrats | Steven Lemin | 447 | 12.4% | |
Majority | 1,276 | 35.4% | ||
Turnout | 3,603 | 37.3% | ||
Conservative hold |
Party | Candidate | Votes | % | |
---|---|---|---|---|
Conservative | Gloria Bragg | 1,003 | 36.5% | |
Labour | Margaret Storer | 983 | 35.7% | |
Liberal Democrats | Ray McSweeney | 559 | 20.3% | |
Green | Roger Creagh-Osborne | 205 | 7.5% | |
Majority | 20 | 0.7% | ||
Turnout | 2,750 | 28.7% | ||
Conservative gain from Labour |
Party | Candidate | Votes | % | |
---|---|---|---|---|
Conservative | Sally Stephens | 1,064 | 36.6% | |
Labour | Valentine Hiromeris | 995 | 34.2% | |
Liberal Democrats | Christina MacCullie | 264 | 9.1% | |
BNP | Michael Antonucci | 233 | 8.0% | |
UKIP | Sean O'Kane | 216 | 7.4% | |
Independent | Jo Jo | 134 | 4.6% | |
Majority | 69 | 2.4% | ||
Turnout | 2,906 | 30.7% | ||
Conservative gain from Labour |
Party | Candidate | Votes | % | |
---|---|---|---|---|
Conservative | Peter Berrow | 1,318 | 38.8% | |
Labour | David Weekes | 1,155 | 34.0% | |
Liberal Democrats | Jane Barwick | 583 | 17.2% | |
BNP | Lawrence Miller | 338 | 10.0% | |
Majority | 163 | 4.8% | ||
Turnout | 3,394 | % | ||
Conservative gain from Labour |
Party | Candidate | Votes | % | |
---|---|---|---|---|
Conservative | David Reynolds | 1,500 | 46.3% | |
Labour | David Haydon | 1,014 | 31.3% | |
Liberal Democrats | Kirsty Barwick | 382 | 11.8% | |
Green | Wendy Miller | 347 | 10.7% | |
Majority | 486 | 15.0% | ||
Turnout | 3,243 | 34.8% | ||
Conservative gain from Labour |
Party | Candidate | Votes | % | |
---|---|---|---|---|
Labour | Edwin Rennie | 985 | 36.0% | |
Conservative | Edmund Shillabeer | 896 | 32.7% | |
Liberal Democrats | Peter York | 413 | 15.1% | |
Green | Tean Mitchell | 227 | 8.3% | |
UKIP | Jonquil Webber | 216 | 7.9% | |
Majority | 89 | 3.3% | ||
Turnout | 2,737 | 28.2% | ||
Labour hold |
The 2006 United Kingdom local elections were held on Thursday 4 May 2006.
Plymouth City Council is the local authority for the a unitary authority of Plymouth in Devon, England. Until 1 April 1998 it was a non-metropolitan district.
The 2008 Barnsley Metropolitan Borough Council election took place on 1 May 2008 to elect members of Barnsley Metropolitan Borough Council in South Yorkshire, England. One third of the council, alongside an additional vacancy in Old Town was up for election. Prior to the election the defending councillor in Penistone West, having earlier defected from Conservative to the Barnsley Independent Group, fought the election as an Independent. The Labour party stayed in overall control of the council.
One third of Woking Borough Council in Surrey, England is elected each year, followed by one year without election. Since the last boundary changes in 2016, 30 councillors have been elected from 10 wards.
The 2010 Plymouth City Council election was held on 6 May 2010 to elect members of Plymouth City Council in England.
The 2011 Plymouth City Council election took place on 5 May 2011 to elect members to Plymouth City Council in England. One third of the council was up for election, in addition to a by-election, making twenty seats in total. The previous election produced a majority for the Conservative Party. The election resulted in Labour gaining 5 seats with Conservatives retaining control.
The 2012 North East Lincolnshire Council election took place on 3 May 2012 to elect members of North East Lincolnshire Council in England. This was on the same day as other 2012 United Kingdom local elections.
The 2012 Plymouth City Council election took place on 3 May 2012 to elect members of Plymouth City Council in England. This was on the same day as other local elections. The election was won by the Labour Party, who gained control of the council from the Conservative Party.
The 2012 Exeter City Council election took place on 3 May 2012, to elect members of Exeter City Council in Devon, England. The election was held concurrently with other local elections in England. One third of the council was up for election; the seats up for election were last contested in 2008. The Labour Party gained overall control of the council, which had been under no overall control since 2003. The Liberal Party was wiped off the council.
The 2010 Leeds City Council election took place on Thursday 6 May 2010 to elect members of Leeds City Council in England. It was held on the same day as the 2010 general election and other local elections across the UK.
The 2008 Leeds City Council election took place on Thursday 1 May 2008 to elect members of Leeds City Council in England.
The 2014 North East Lincolnshire Council election took place on 22 May 2014 to elect members of North East Lincolnshire Council in England. This was on the same day as other local elections. These elections saw UKIP making significant gains largely at the expense of Labour, and stripping them of their majority on the council.
The 2014 Plymouth City Council election took place on 22 May 2014 to elect members of Plymouth City Council in England. This was on the same day as other local elections. The election was won by the Labour Party, who maintained their overall majority. The UK Independence Party gained representation on the council for the first time, and this was the only election in which the party won seats in Plymouth.
The 2015 Plymouth City Council election took place on 7 May 2015 to elect members of Plymouth City Council in England.
The 2016 Plymouth City Council election took place on 5 May 2016 to elect members of Plymouth City Council in England. The Conservatives gained one seat from Labour, resulting in both parties having twenty-seven members of the council. A coalition of Conservative and UKIP members took overall control of the Council, having thirty members in total and a working majority.
The 2017 United Kingdom local elections were held on Thursday 4 May 2017. Local elections were held across Great Britain, with elections to 35 English local authorities and all councils in Scotland and Wales.
The 2018 Plymouth City Council election took place on 3 May 2018 to elect members of Plymouth City Council in England. The election was won by the Labour Party, who gained enough seats to achieve an overall majority and took control of the council.
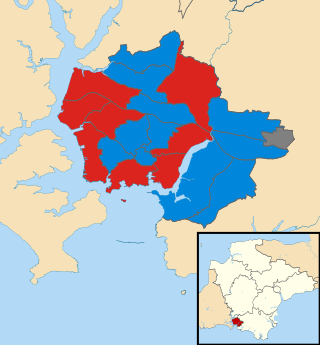
The 2007 Plymouth City Council election was held on 3 May 2007 to elect members of Plymouth City Council in England. One third of the council was up for election and the Conservative Party gained control of the council from the Labour Party.
The 2010 Exeter City Council election took place on 9 September 2010 to elect members of Exeter City Council in England. One third of seats were up for election. The elections took place later in the year than other local elections. Exeter had previously been granted permission to become a unitary authority, with local elections postponed until 2011. When the Coalition Government won the general election earlier that year, Exeter's permission to form a unitary authority was overturned. Because of this, the High Court ruled that those councillors who had stayed on beyond their four-year term were no longer constitutionally elected, and would need to seek re-election. This resulted in there being an election in every ward in September to renew the mandate for the wards.
The 2023 Plymouth City Council election was held on 4 May 2023 to elect members of Plymouth City Council in England. It coincided with local elections across the United Kingdom.