Lambeth London Borough Council is elected every four years.
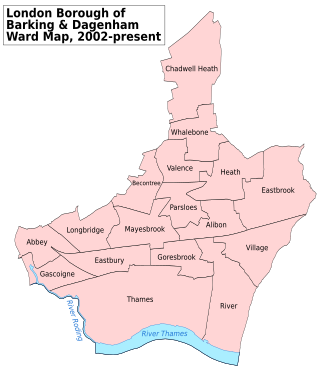
Barking and Dagenham London Borough Council in London, England is elected every four years. Since the last boundary changes in 2022 the council has comprised 51 councillors representing 19 wards, with each ward electing two or three councillors. Elections are held every four years.

Elections for the Croydon London Borough Council are held every four years to elect 70 councillors. The last ward boundary changes came into force at the 2018 local elections.
Torbay Council is the local authority for the unitary authority of Torbay in Devon, England. Until 1 April 1998 it was a non-metropolitan district. From 2005 to 2019 it had a directly elected mayor. The council is elected every four years.

In England, directly elected mayors are directly elected executive political leaders of some local government bodies, usually either local authorities (councils) or combined authorities. Mayors of the latter may be informally referred to as “metro mayors”.
Weymouth and Portland Borough Council in Dorset, England existed from 1974 to 2019. One-third of the council was elected each year, followed by one year where there was an election to Dorset County Council instead. The council was abolished and subsumed into Dorset Council in 2019.

Redbridge London Borough Council in London, England is elected every four years.

Enfield London Borough Council in London, England is elected every four years. Since the last boundary changes in 2022, 63 councillors have been elected from 25 wards.

Lewisham London Borough Council is the local authority for the London Borough of Lewisham, in London, United Kingdom. Elections are held every four years using a plurality bloc vote electoral system for the councillors and the supplementary vote electoral system for the elected mayor.
Southwark London Borough Council is the local authority for the London Borough of Southwark in London, England. The council is elected every four years. Since the last boundary changes in 2018, 63 councillors have been elected from 23 wards.

Waltham Forest London Borough Council in London is elected every four years. Since the last boundary changes in 2022, 60 councillors have been elected from 22 wards, with 2 or 3 councillors per ward.

Westminster City Council, the local authority of the City of Westminster in London, England, is elected every four years. Since the last boundary changes in 2022 the council has comprised 54 councillors representing 18 wards, with each ward electing three councillors. Elections are held every four years.

Greenwich London Borough Council is the local authority for the Royal Borough of Greenwich in London, England. The council is elected every four years. Since the last boundary changes in 2022, 55 councillors have been elected from 23 wards.
Wandsworth London Borough Council, England, is elected every four years. From 2002 to 2018, 60 councillors were elected from 20 wards. Following ward boundary changes, in 2022 58 councillors were elected in 22 wards returning either 2 or 3 councillors each.

Torbay Council is the local authority for Torbay, a local government district in the ceremonial county of Devon, England. Since 1998 the council has been a unitary authority, being a district council which also performs the functions of a county council; it is independent from Devon County Council.

The 2014 Lambeth Council election was held on 22 May 2014 to elect members of Lambeth Borough Council in Greater London, England. This was on the same day as other local elections. The election saw the Labour Party further increase its majority on the council, winning all but four of the 63 council seats.

The 2015 Havant Borough Council election took place on 7 May 2015 to elect members of the Havant Borough Council in England. It was held on the same day as other local elections.

The 2017 Dorset County Council election took place on 4 May 2017 as part of the 2017 local elections in the United Kingdom. All 46 councillors were elected from 40 electoral divisions, which returned either one or two county councillors each by first-past-the-post voting for a four-year term of office.

The 2019 United Kingdom local elections took place on Thursday 2 May 2019, with 248 English local councils, six directly elected mayors in England, and all 11 local councils in Northern Ireland being contested.

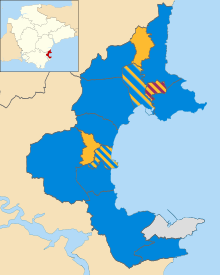
The 2019 Torbay Council election took place on 2 May 2019 to elect members of Torbay Council in England. This was on the same day as other local elections. The Conservatives lost the council to no overall control.