District result maps
 2003 results map
 2007 results map
 2011 results map
 2015 results map
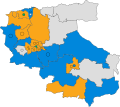 2019 results map
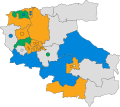 2023 results map
North Devon Council in Devon, England is elected every four years.
| Year | Conservative | Liberal Democrats [a] | Labour | Green [b] | UKIP | Independents & Others | Council control after election | |
|---|---|---|---|---|---|---|---|---|
| Local government reorganisation; council established (44 seats) | ||||||||
| 1973 | 1 | 14 | 1 | – | – | 28 | Independent | |
| 1976 | 5 | 12 | 0 | 0 | – | 27 | Independent | |
| 1979 | 9 | 6 | 0 | 0 | – | 29 | Independent | |
| New ward boundaries (44 seats) | ||||||||
| 1983 | 9 | 8 | 1 | 0 | – | 26 | Independent | |
| 1987 | 9 | 16 | 0 | 0 | – | 19 | No overall control | |
| 1991 | 2 | 26 | 0 | 0 | – | 16 | Liberal Democrats | |
| 1995 | 1 | 30 | 0 | 0 | 0 | 13 | Liberal Democrats | |
| 1999 | 5 | 26 | 0 | 0 | 0 | 13 | Liberal Democrats | |
| New ward boundaries (43 seats) | ||||||||
| 2003 | 10 | 22 | 0 | 0 | 1 | 10 | Liberal Democrats | |
| 2007 | 22 | 17 | 0 | 0 | 0 | 4 | Conservative | |
| 2011 | 18 | 14 | 0 | 0 | 0 | 11 | No overall control | |
| 2015 | 19 | 12 | 0 | 0 | 1 | 11 | No overall control | |
| New ward boundaries (42 seats) | ||||||||
| 2019 | 12 | 21 | 0 | 2 | 0 | 7 | Liberal Democrats | |
| 2023 | 7 | 22 | 0 | 3 | 0 | 10 | Liberal Democrats | |


| Party | Candidate | Votes | % | ±% | |
|---|---|---|---|---|---|
| Liberal Democrats | 591 | 73.8 | |||
| Conservative | 131 | 16.4 | |||
| Labour | 78 | 9.8 | |||
| Majority | 460 | 57.4 | |||
| Turnout | 800 | ||||
| Liberal Democrats hold | Swing | ||||
| Party | Candidate | Votes | % | ±% | |
|---|---|---|---|---|---|
| Independent | 280 | 32.2 | −6.6 | ||
| Independent | 220 | 25.3 | +2.2 | ||
| Labour | 189 | 21.7 | +21.7 | ||
| Conservative | 180 | 20.7 | +20.7 | ||
| Majority | 60 | 6.9 | |||
| Turnout | 869 | 32.0 | |||
| Independent hold | Swing | ||||
| Party | Candidate | Votes | % | ±% | |
|---|---|---|---|---|---|
| Liberal Democrats | Christopher Haywood | 255 | 57.3 | +1.7 | |
| Independent | Alfred Dibble | 123 | 27.6 | −3.4 | |
| Conservative | John Knill | 67 | 15.1 | +1.7 | |
| Majority | 132 | 29.7 | |||
| Turnout | 445 | 18.0 | |||
| Liberal Democrats hold | Swing | ||||
| Party | Candidate | Votes | % | ±% | |
|---|---|---|---|---|---|
| Liberal Democrats | Derrick Spear | 384 | 43.5 | −7.1 | |
| Conservative | Douglas Green | 378 | 42.8 | −6.6 | |
| Green | Michael Harrison | 121 | 13.7 | +13.7 | |
| Majority | 6 | 0.7 | |||
| Turnout | 883 | 28.0 | |||
| Liberal Democrats gain from Conservative | Swing | ||||
| Party | Candidate | Votes | % | ±% | |
|---|---|---|---|---|---|
| Liberal Democrats | Janet Carter | 307 | 62.5 | +27.0 | |
| Conservative | Simon Harvey | 120 | 24.4 | +4.5 | |
| Green | Earl Bramley-Howard | 35 | 7.1 | +7.1 | |
| Independent | Charles Piper | 29 | 5.9 | −38.7 | |
| Majority | 187 | 38.1 | |||
| Turnout | 491 | 15.0 | |||
| Liberal Democrats hold | Swing | ||||
| Party | Candidate | Votes | % | ±% | |
|---|---|---|---|---|---|
| Conservative | Jeremy Yabsley | 448 | 58.5 | −0.2 | |
| Liberal Democrats | Kate Palmer | 318 | 41.5 | +0.2 | |
| Majority | 130 | 17.0 | |||
| Turnout | 766 | 42.0 | |||
| Conservative hold | Swing | ||||
| Party | Candidate | Votes | % | ±% | |
|---|---|---|---|---|---|
| Independent | Christopher Turner | 501 | 46.9 | ||
| Conservative | John Gill | 308 | 28.8 | +16.2 | |
| Independent | Anthony Wood | 196 | 18.3 | ||
| Green | Neil Basil | 64 | 6.0 | +6.0 | |
| Majority | 193 | 18.1 | |||
| Turnout | 1,069 | 30.0 | −24.0 | ||
| Independent hold | Swing | ||||
| Party | Candidate | Votes | % | ±% | |
|---|---|---|---|---|---|
| Liberal Democrats | Derrick Spear | 459 | 37.1 | +3.0 | |
| Green | Brad Bunyard | 387 | 31.3 | +10.5 | |
| Conservative | Felix Milton | 225 | 18.2 | −17.5 | |
| Labour | Mark Cann | 165 | 13.3 | +6.3 | |
| Majority | 72 | 5.8 | |||
| Turnout | 1,236 | ||||
| Liberal Democrats gain from Conservative | Swing | ||||
| Party | Candidate | Votes | % | ±% | |
|---|---|---|---|---|---|
| Liberal Democrats | Caroline Leaver | 390 | 38.8 | +7.1 | |
| Conservative | Martin Kennaugh | 373 | 37.1 | −2.9 | |
| Green | Ricky Knight | 159 | 15.8 | −12.6 | |
| Labour | Siobhan Strode | 83 | 8.3 | +8.3 | |
| Majority | 17 | 1.7 | |||
| Turnout | 1,005 | ||||
| Liberal Democrats gain from Conservative | Swing | ||||
| Party | Candidate | Votes | % | ±% | |
|---|---|---|---|---|---|
| Independent | Jayne Mackie | 577 | 50.8 | +50.8 | |
| Conservative | Jim Pilkington | 356 | 31.3 | +12.8 | |
| Liberal Democrats | Graham Lofthouse | 119 | 10.5 | +10.5 | |
| Labour | Blake Ladley | 65 | 5.7 | +5.7 | |
| Green | Lou Goodger | 19 | 1.7 | −8.0 | |
| Majority | 221 | 19.5 | |||
| Turnout | 1,136 | ||||
| Independent hold | Swing | ||||
| Party | Candidate | Votes | % | ±% | |
|---|---|---|---|---|---|
| Liberal Democrats | Victoria Nel | 374 | 42.7 | +7.4 | |
| Conservative | David Hoare | 237 | 27.1 | −14.4 | |
| Green | Mark Haworth-Booth | 228 | 26.1 | +10.6 | |
| Labour | Nicholas Agnew | 36 | 4.1 | −3.6 | |
| Majority | 137 | 15.7 | |||
| Turnout | 875 | ||||
| Liberal Democrats gain from Conservative | Swing | ||||
| Party | Candidate | Votes | % | ±% | |
|---|---|---|---|---|---|
| Liberal Democrats | Becky Coombs | 197 | 38.1 | ||
| Conservative | Christopher Hopkins | 166 | 32.1 | ||
| Reform UK | Richard Booth | 88 | 17.0 | ||
| Independent | Graham Payne | 49 | 9.5 | ||
| Green | Howard Porter | 17 | 3.3 | ||
| Majority | 31 | 6.0 | |||
| Turnout | 517 | ||||
| Liberal Democrats gain from Conservative | Swing | ||||
| Party | Candidate | Votes | % | ±% | |
|---|---|---|---|---|---|
| Liberal Democrats | Loki Dawson | 716 | 40.2 | ||
| Reform UK | David Jarvis | 581 | 32.6 | ||
| Green | Howard Porter | 212 | 11.9 | ||
| Conservative | Lisa MacKenzie | 208 | 11.7 | ||
| Labour | Rhys Jones | 65 | 3.6 | ||
| Majority | 135 | 7.6 | |||
| Turnout | 1,789 | 29.17 | |||
| Liberal Democrats hold | |||||
| Party | Candidate | Votes | % | ±% | |
|---|---|---|---|---|---|
| Liberal Democrats | Josh Rutty | 505 | 40.5 | ||
| Reform UK | David Jarvis | 383 | 30.7 | ||
| Conservative | Lisa Mackenzie | 205 | 16.4 | ||
| Green | David Smale | 154 | 12.3 | ||
| Majority | 122 | 9.8 | |||
| Turnout | 1,247 | ||||
| Liberal Democrats hold | |||||