This article needs additional citations for verification .(March 2020) |
| ||||||||||||||||||||||||||||
All 60 seats in the Plymouth City Council 31 seats needed for a majority | ||||||||||||||||||||||||||||
---|---|---|---|---|---|---|---|---|---|---|---|---|---|---|---|---|---|---|---|---|---|---|---|---|---|---|---|---|
| ||||||||||||||||||||||||||||
![]() Map showing the results of the 1991 Plymouth City Council elections. | ||||||||||||||||||||||||||||
|
The 1991 Plymouth City Council election took place on 2 May 1991 to elect members of Plymouth City Council in Devon, England. This was on the same day as other local elections. The Labour Party gained control of the council from the Conservative Party, who had held it since its creation in 1973. [1]
Party | Seats | Gains | Losses | Net gain/loss | Seats % | Votes % | Votes | +/− | |
---|---|---|---|---|---|---|---|---|---|
Labour | 41 | 22 | 0 | ![]() | 31.7 | 43.8 | 41,401 | ![]() | |
Conservative | 19 | 0 | 12 | ![]() | 68.3 | 33.5 | 31,669 | ![]() | |
Liberal Democrats | 0 | 0 | 10 | ![]() | 0.0 | 16.7 | 15,774 | ![]() | |
SDP | 0 | 0 | 0 | ![]() | 0.0 | 6.1 | 5,767 | New | |
Total | 60 | 94,611 |
Party | Candidate | Votes | % | |
---|---|---|---|---|
Labour | C. Payne | 2,752 | ||
Labour | R. Simmonds | 2,744 | ||
Labour | T. Coleman | 2,590 | ||
SDP | P. Rowe | 572 | ||
SDP | L. Rowe | 571 | ||
Conservative | K. Banks | 557 | ||
Conservative | G. Horler | 541 | ||
Conservative | J. Mahony | 523 | ||
Liberal Democrats | M. Gallagher | 394 | ||
SDP | P. Stanner | 389 | ||
Liberal Democrats | W. Villagio | 368 | ||
Liberal Democrats | S. Hipkiss | 345 | ||
Turnout | 50.9% | |||
Labour hold | ||||
Labour gain from Liberal Democrats | ||||
Labour hold |
Party | Candidate | Votes | % | |
---|---|---|---|---|
Conservative | T. Savery | 2,232 | ||
Conservative | P. Wood | 2,168 | ||
Conservative | M. Chapman | 2,164 | ||
Labour | J. Burton | 972 | ||
Labour | H. Watson | 963 | ||
Labour | P. Ingham | 963 | ||
Liberal Democrats | G. Airey | 891 | ||
Liberal Democrats | A. McKelvie | 781 | ||
Liberal Democrats | T. Longworth | 738 | ||
Turnout | 50.6% | |||
Conservative hold | ||||
Conservative hold |
Party | Candidate | Votes | % | |
---|---|---|---|---|
Conservative | V. Pengelly | 1,891 | ||
Labour | C. Burgess | 1,872 | ||
Labour | E. Colley | 1,830 | ||
Labour | G. Payne | 1,818 | ||
Conservative | J. Thorpe | 1,725 | ||
Conservative | S. Hole | 1,709 | ||
Liberal Democrats | J. Longworth | 743 | ||
Liberal Democrats | R. Blank | 742 | ||
Liberal Democrats | M. Flippance | 724 | ||
Turnout | 48.8% | |||
Conservative hold | ||||
Labour gain from Conservative | ||||
Labour gain from Conservative |
Party | Candidate | Votes | % | |
---|---|---|---|---|
Labour | I. Tuffin | 2,679 | ||
Labour | G. Draper | 2,645 | ||
Labour | H. Welch | 2,397 | ||
Conservative | C. Stanbury | 1,637 | ||
Conservative | K. Banks | 1,591 | ||
Conservative | M. Leaves | 1,547 | ||
Liberal Democrats | R. Vosper | 1,427 | ||
Liberal Democrats | J. Cornish | 1,388 | ||
Turnout | 54.3% | |||
Labour hold | ||||
Labour hold | ||||
Labour gain from Conservative |
Party | Candidate | Votes | % | |
---|---|---|---|---|
Labour | D. Bray | 2,526 | ||
Labour | P. Lee | 2,347 | ||
Labour | R. Gachagan | 2,273 | ||
Conservative | J. Pascoe | 2,062 | ||
Conservative | R. Morrell | 2,016 | ||
Conservative | D. Mackinem | 1,866 | ||
Liberal Democrats | A. Nelmes | 1,181 | ||
Liberal Democrats | B. Coe | 1,113 | ||
Liberal Democrats | J. Byatt | 975 | ||
Turnout | 57.7% | |||
Labour gain from Conservative | ||||
Labour gain from Conservative |
Party | Candidate | Votes | % | |
---|---|---|---|---|
Conservative | T. Jones | 2,285 | ||
Conservative | V. Hoy | 2,249 | ||
Conservative | K. Wigens | 2,217 | ||
Labour | C. Demuth | 1,983 | ||
Labour | B. Young | 1,924 | ||
Labour | A. Lemin | 1,923 | ||
SDP | R. Goodson | 1,080 | ||
SDP | F. Tapscott | 1,077 | ||
SDP | I. Lucas | 990 | ||
Turnout | 50.1% | |||
Conservative hold | ||||
Conservative hold |
Party | Candidate | Votes | % | |
---|---|---|---|---|
Labour | B. Rider | 2,885 | ||
Labour | K. Prowse | 2,723 | ||
Labour | T. Evans | 2,650 | ||
Conservative | B. Gibson | 742 | ||
Conservative | Y. Horler | 686 | ||
Conservative | L. Noden | 645 | ||
SDP | D. Mound | 584 | ||
SDP | M. Yardley | 580 | ||
Turnout | 51.2% | |||
Labour hold | ||||
Labour hold | ||||
Labour hold |
Party | Candidate | Votes | % | |
---|---|---|---|---|
Labour | J. Ingham | 3,440 | ||
Labour | P. Whitfield | 3,372 | ||
Labour | R. Burton | 3,118 | ||
Conservative | J. Brimacombe | 967 | ||
Conservative | E. Hughes | 893 | ||
Conservative | J. Wallace | 886 | ||
Liberal Democrats | M. Evens | 733 | ||
SDP | P. Murphy | 435 | ||
SDP | B. Tapscott | 409 | ||
Turnout | 52.8% | |||
Labour hold | ||||
Labour hold | ||||
Labour hold |
Party | Candidate | Votes | % | |
---|---|---|---|---|
Labour | M. Sheaff | 2,019 | ||
Labour | R. Lemin | 1,979 | ||
Labour | T. Smith | 1,913 | ||
SDP | H. Furzeman | 1,506 | ||
SDP | I. Higgins | 1,432 | ||
SDP | L. Woodcock | 1,425 | ||
Conservative | M. Derbyshire | 753 | ||
Conservative | M. Orchard | 654 | ||
Conservative | R. Williams | 628 | ||
Turnout | 52.0% | |||
Labour gain from Liberal Democrats | ||||
Labour gain from Liberal Democrats |
Party | Candidate | Votes | % | |
---|---|---|---|---|
Labour | V. Grout | 1,960 | ||
Labour | A. Hall | 1,941 | ||
Labour | P. Coyle | 1,897 | ||
Conservative | B. Carter | 1,163 | ||
Conservative | H. George | 1,117 | ||
Conservative | J. Kingdom | 1,112 | ||
Liberal Democrats | A. Cameron | 727 | ||
Liberal Democrats | S. Knight | 557 | ||
Liberal Democrats | K. Robinson | 529 | ||
Turnout | 50.2% | |||
Labour gain from Liberal Democrats | ||||
Labour gain from Liberal Democrats |
Party | Candidate | Votes | % | |
---|---|---|---|---|
Conservative | J. Mills | 2,297 | ||
Conservative | A. Wright | 2,227 | ||
Conservative | J. Richards | 2,227 | ||
Liberal Democrats | L. Howorth | 1,446 | ||
Liberal Democrats | M. Williams | 1,421 | ||
Liberal Democrats | J. Peacock | 1,409 | ||
Labour | V. Burns | 1,374 | ||
Labour | J. Williams | 1,306 | ||
Labour | A. Dymond | 1,250 | ||
Turnout | 44.9% | |||
Conservative hold | ||||
Conservative hold |
Party | Candidate | Votes | % | |
---|---|---|---|---|
Conservative | J. Stopporton | 2,421 | ||
Conservative | O. Hughes | 2,265 | ||
Conservative | Gary Streeter | 2,250 | ||
Liberal Democrats | G. Morris | 1,625 | ||
Liberal Democrats | P. Howard | 1,545 | ||
Liberal Democrats | C. Rendle | 1,488 | ||
Labour | D. Mills | 996 | ||
Labour | P. Smith | 957 | ||
Labour | T. Nally | 956 | ||
Turnout | 54.8% | |||
Conservative hold | ||||
Conservative hold |
Party | Candidate | Votes | % | |
---|---|---|---|---|
Conservative | D. Dicker | 2,948 | ||
Conservative | P. Hocken | 2,843 | ||
Conservative | D. Viney | 2,758 | ||
Liberal Democrats | C. Forte | 1,317 | ||
Liberal Democrats | S. Harding | 1,299 | ||
Liberal Democrats | G. Unwin | 1,264 | ||
Labour | H. Biles | 1,142 | ||
Labour | W. Smale | 1,049 | ||
Labour | T. Woodman | 961 | ||
Turnout | 52.7% | |||
Conservative hold | ||||
Conservative hold |
Party | Candidate | Votes | % | |
---|---|---|---|---|
Conservative | C. Easton | 2,348 | ||
Conservative | I. Bowyer | 1,954 | ||
Conservative | K. Moyse | 1,953 | ||
Labour | R. Earl | 1,310 | ||
Labour | P. Allan | 1,217 | ||
Labour | J. Nicholson | 1,132 | ||
Liberal Democrats | B. Grundy | 1,000 | ||
Liberal Democrats | W. Maddick | 898 | ||
Liberal Democrats | A. Dudson | 874 | ||
Turnout | 53.3% | |||
Conservative hold | ||||
Conservative hold |
Party | Candidate | Votes | % | |
---|---|---|---|---|
Labour | W. Ainsworth | 2,989 | ||
Labour | D. Camp | 2,940 | ||
Labour | J. Jones | 2,874 | ||
Conservative | M. Gibson | 1,111 | ||
Conservative | A. Marshall-Clarke | 1,004 | ||
Liberal Democrats | J. Benson | 1,003 | ||
Conservative | A. Sloggett | 945 | ||
Turnout | 47.3% | |||
Labour hold | ||||
Labour hold | ||||
Labour hold |
Party | Candidate | Votes | % | |
---|---|---|---|---|
Labour | W. Wraight | 2,109 | ||
Labour | J. Coyle | 2,093 | ||
Labour | J. Payne | 2,030 | ||
SDP | H. Luscombe | 1,590 | ||
SDP | A. Ford | 1,152 | ||
Conservative | E. Deacon | 801 | ||
Liberal Democrats | W. Gallagher | 770 | ||
Conservative | M. Campbell | 684 | ||
Conservative | F. Sullivan | 681 | ||
Turnout | 52.1% | |||
Labour gain from Liberal Democrats | ||||
Labour gain from Liberal Democrats |
Party | Candidate | Votes | % | |
---|---|---|---|---|
Labour | S. Bellamy | 2,190 | ||
Labour | P. Kelly | 2,087 | ||
Labour | M. Riggs | 2,076 | ||
Conservative | J. Parry | 718 | ||
Conservative | C. Robinson | 691 | ||
Conservative | P. Smith | 625 | ||
Liberal Democrats | J. Bristow-Watson | 453 | ||
Liberal Democrats | D. Charlesworth | 427 | ||
Liberal Democrats | P. York | 405 | ||
Turnout | 44.4% | |||
Labour hold | ||||
Labour hold | ||||
Labour hold |
Party | Candidate | Votes | % | |
---|---|---|---|---|
Labour | D. Millar | 2,031 | ||
Labour | T. Martin | 2,025 | ||
Labour | J. Millar | 1,937 | ||
Conservative | P. Nicholson | 1,818 | ||
Conservative | C. Pascoe | 1,815 | ||
Conservative | G. Monahan | 1,613 | ||
Liberal Democrats | J. Dean | 1,146 | ||
Liberal Democrats | J. Evans | 1,074 | ||
Liberal Democrats | P. York | 983 | ||
Turnout | 52.2% | |||
Labour gain from Conservative | ||||
Labour gain from Conservative |
Party | Candidate | Votes | % | |
---|---|---|---|---|
Labour | J. Finnigan | 2,265 | ||
Labour | J. Nelder | 2,123 | ||
Labour | C. Mavin | 2,084 | ||
Conservative | F. Brimacombe | 1,121 | ||
Conservative | J. Ellis | 953 | ||
Conservative | M. Greenhalgh | 836 | ||
Liberal Democrats | G. Pedrick | 484 | ||
Liberal Democrats | P. Jones | 480 | ||
Liberal Democrats | S. Longworth | 469 | ||
Turnout | 50.3% | |||
Labour hold | ||||
Labour hold | ||||
Labour hold |
Party | Candidate | Votes | % | |
---|---|---|---|---|
Labour | C. Brimblecombe | 1,907 | ||
Labour | J. Blower | 1,902 | ||
Labour | H. Davey | 1,873 | ||
Conservative | D. Ackland | 1,797 | ||
Conservative | P. Nicholson | 1,778 | ||
Conservative | V. Williams | 1,754 | ||
Liberal Democrats | M. Hazell | 434 | ||
Liberal Democrats | S. Guy | 415 | ||
Liberal Democrats | S. McConnell | 401 | ||
Turnout | 62.8% | |||
Labour gain from Conservative | ||||
Labour gain from Conservative |
Plymouth City Council is the local authority for the a unitary authority of Plymouth in Devon, England. Until 1 April 1998 it was a non-metropolitan district.
The 2010 Plymouth City Council election was held on 6 May 2010 to elect members of Plymouth City Council in England.
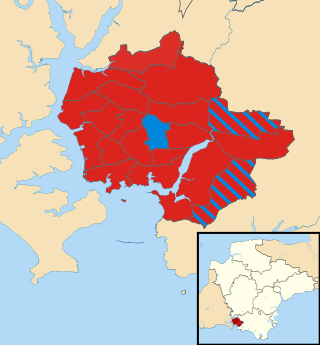
The 2011 Plymouth City Council election took place on 5 May 2011 to elect members to Plymouth City Council in England. One third of the council was up for election, in addition to a by-election, making twenty seats in total. The previous election produced a majority for the Conservative Party. The election resulted in Labour gaining 5 seats with Conservatives retaining control.
The 2012 Plymouth City Council election took place on 3 May 2012 to elect members of Plymouth City Council in England. This was on the same day as other local elections. The election was won by the Labour Party, who gained control of the council from the Conservative Party.
The 2014 Plymouth City Council election took place on 22 May 2014 to elect members of Plymouth City Council in England. This was on the same day as other local elections. The election was won by the Labour Party, who maintained their overall majority. The UK Independence Party gained representation on the council for the first time, and this was the only election in which the party won seats in Plymouth.
The 2015 Plymouth City Council election took place on 7 May 2015 to elect members of Plymouth City Council in England.
The 2016 Plymouth City Council election took place on 5 May 2016 to elect members of Plymouth City Council in England. The Conservatives gained one seat from Labour, resulting in both parties having twenty-seven members of the council. A coalition of Conservative and UKIP members took overall control of the Council, having thirty members in total and a working majority.
The 1995 Cardiff Council election was the first election to the new unitary County Council of the City and County of Cardiff following the re-organization of local government in Wales. It was held on Thursday 4 May 1995. It was followed by the 1999 elections. On the same day there were elections to the other 21 local authorities in Wales and community councils in Wales. Labour won a majority of the seats. It was preceded in Cardiff by the 1991 elections to Cardiff City Council and the 1993 elections to South Glamorgan County Council.
The 2018 Plymouth City Council election took place on 3 May 2018 to elect members of Plymouth City Council in England. The election was won by the Labour Party, who gained enough seats to achieve an overall majority and took control of the council.
The 2019 Plymouth City Council election was held on 2 May 2019 to elect members of Plymouth City Council in England.
The 2007 Plymouth City Council election was held on 3 May 2007 to elect members of Plymouth City Council in England. One third of the council was up for election and the Conservative Party gained control of the council from the Labour Party.
The 2003 Plymouth City Council election was held on 1 May 2003 to elect members of Plymouth City Council in England. This was on the same day as the other local elections. The election was the first to be contested under new ward boundaries, and as a result the entire council was up for election. The Labour Party regained control of the council, which it had lost to the Conservative Party at the previous election in 2000.
The 2000 Plymouth City Council election was held on 4 May 2000 to elect members of Plymouth City Council in England. This was on the same day as the other local elections. The entire council was up for election and the Conservative Party gained control of the council from the Labour Party.
The 1995 Plymouth City Council election took place on 4 May 1995 to elect members of Plymouth City Council in Devon, England. This was on the same day as other local elections. The Labour Party retained control of the council, which it had gained from the Conservative Party at the previous election in 1991.
The 1997 Plymouth City Council election took place on 1 May 1997 to elect members of Plymouth City Council in Devon, England. This was on the same day as other local elections. The Labour Party retained control of the council, which it had held since 1991.
The 2002 Exeter City Council election took place on 2 May 2002, to elect members of Exeter City Council in England. The election was held concurrently with other local elections in England. One third of the council was up for election and the Labour Party retained control of the council, which it had held since 1995.
The 2003 Exeter City Council election took place on 1 May 2003, to elect members of Exeter City Council in Devon, England. The election was held concurrently with other local elections in England. One third of the council was up for election and the Labour Party lost control of the council, which it had held since 1995.
The 2021 Plymouth City Council election was held on 6 May 2021 to elect members of Plymouth City Council in England.
The 1991 Ipswich Borough Council election was an election to the Ipswich Borough Council under the arrangement, whereby a third of the councillors were to stand for election, each time.
The 2022 Plymouth City Council election took place on 5 May 2022 to elect members of Plymouth City Council in England. It coincided with local elections across the United Kingdom. The Conservative Party made gains in the previous election in 2021, resulting in the council entering no overall control with no party holding a majority of seats. Immediately following the results of the 2022 election, the council remained in no overall control. Labour and the Conservatives gained seats from independent councillors who had left their parties and exchanged seats with each other. The election saw the elections of the city's first Green Party councillor, Ian Poyser, and first trans councillor, Dylan Tippetts of the Labour Party.